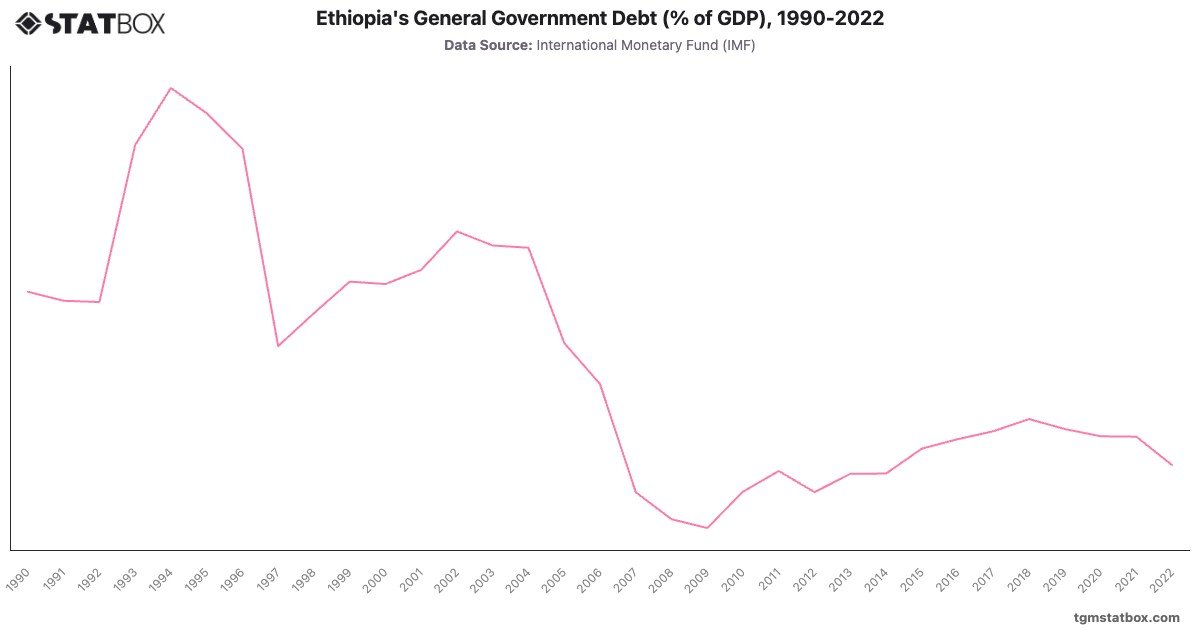
Ethiopia's government debt as a percentage of GDP has fluctuated significantly over the decades, shaped by economic reforms, political challenges, and external financial assistance. In the early 1990s, debt levels were high, peaking at in 1994 due to the economic strain of the Ethiopian Civil War and post-war reconstruction. This period marked significant borrowing to rebuild infrastructure and stabilize the economy.
Debt levels began to decline from the late 1990s, reaching in 2008, largely due to debt relief initiatives under the Heavily Indebted Poor Countries (HIPC) program and improved fiscal discipline. However, from 2010 onward, debt levels gradually increased, peaking at in 2018. This rise reflects Ethiopia's aggressive public investment in infrastructure, particularly in energy and transportation, under its Growth and Transformation Plans. By 2022, debt had reduced to of GDP, signaling efforts to balance development goals with fiscal sustainability amidst global economic challenges.
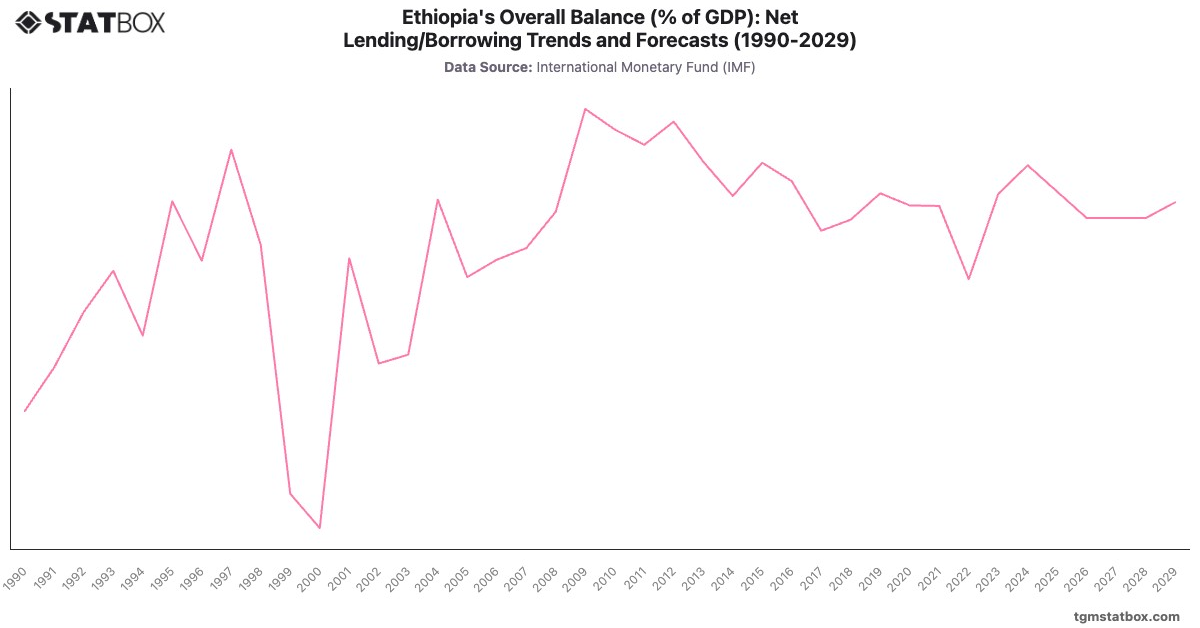
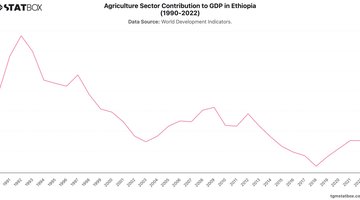
Find out more through related statistics on Ethiopia’s agriculture sector GDP share, Ethiopia’s annual GDP figures, Ethiopia’s net lending/borrowing.