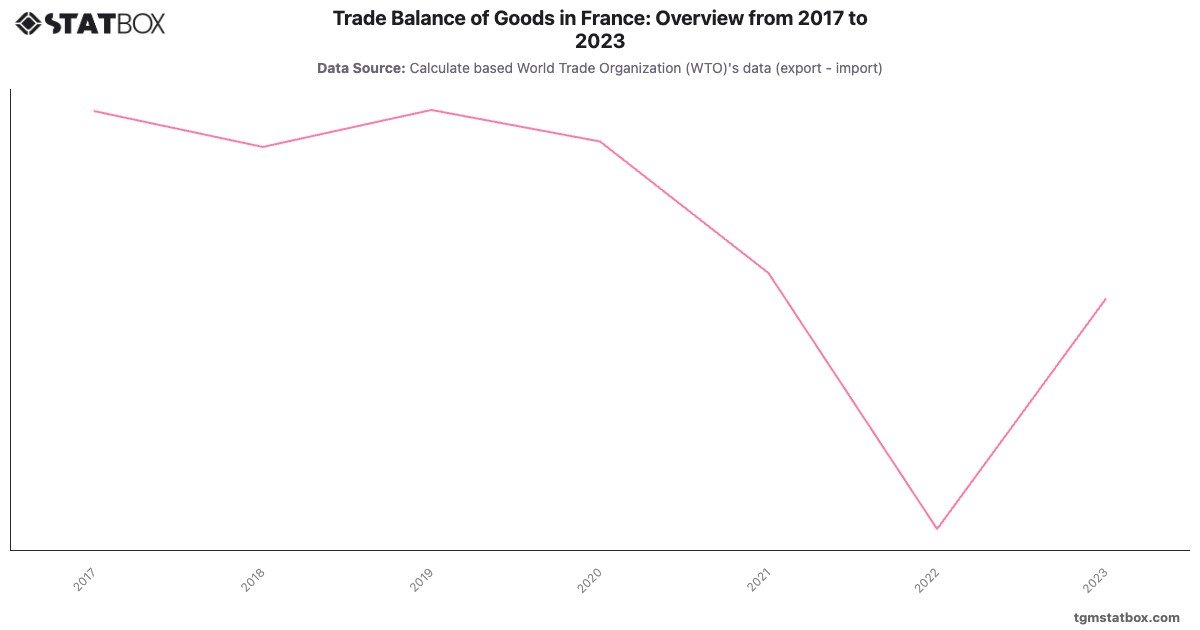
France experienced a persistently widening trade deficit from -84,036.1 million USD in 2017 to a record high of -202,755.1 million USD in 2022, driven by surging energy import costs and declining competitiveness in manufacturing exports. The sharp increase in 2022 was heavily influenced by the European energy crisis, which amplified the cost of imported fuel and natural gas.
The deficit improved to -137,403.4 million USD in 2023, reflecting a moderation in energy prices and a slight recovery in exports of high-value goods like aerospace and luxury products. However, France’s ongoing trade challenges stem from its reliance on energy imports and limited industrial competitiveness in some sectors, necessitating policy interventions to improve export performance and energy efficiency.
The deficit improved to -137,403.4 million USD in 2023, reflecting a moderation in energy prices and a slight recovery in exports of high-value goods like aerospace and luxury products. However, France’s ongoing trade challenges stem from its reliance on energy imports and limited industrial competitiveness in some sectors, necessitating policy interventions to improve export performance and energy efficiency.
Find out more through related statistics on France’s goods import value, France’s agriculture share in GDP, manufacturing sector’s share in France’s GDP.