Among the top online shopping categories among French consumers in 2026, clothing and accessories dominates decisively, with two in three respondents (66%) having purchased apparel online in the past 12 months. Footwear ranks a distant second at 41%, followed by groceries and fresh food at 33% — a notable result reflecting the continued expansion of online grocery adoption in France. Beauty and skincare (30%) and electronics and gadgets (23%) round out the upper tier, highlighting a consumer base that shops broadly across both lifestyle and practical categories.
A meaningful mid-tier cluster emerges between 15% and 22%, encompassing personal care and hygiene, appliances, home essentials, and digital products such as apps, games, and subscriptions. Home décor and furnishings (20%) and pet supplies (19%) also register solidly. Baby and kids products record the lowest share at just 8%, consistent with France's shifting demographic profile — a trend visible in data tracking the changing median age of population in France between 2000 and 2030. Only 7% of respondents report purchasing in none of these categories, confirming that online shopping is now a near-universal behavior.
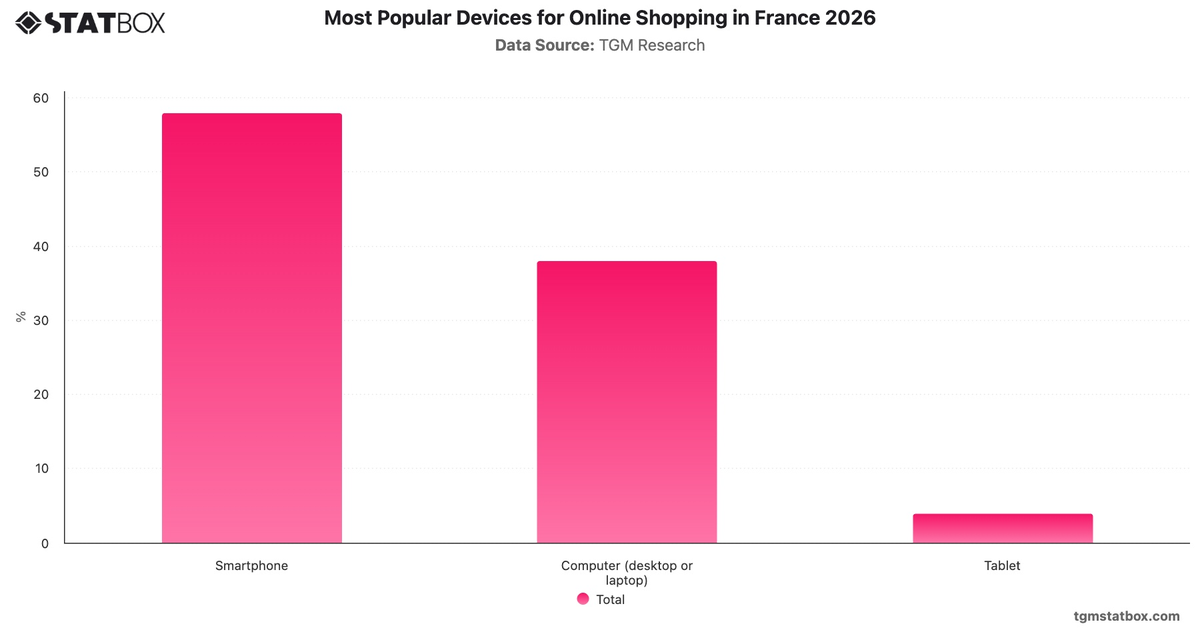
The breadth of category engagement reflects a mature e-commerce market shaped by broader economic conditions. France GDP Growth Rate by Year and Device Usage Breakdown in France together help contextualize why digital retail penetration spans so many product types, from everyday consumables to high-consideration purchases like appliances and electronics.