Insights library
Not sure where to start? Dive into a diverse selection of charts and data visualizations across topics, and find the information you need to drive your research and analysis.
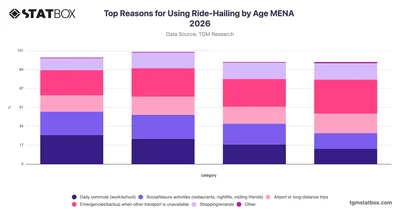

Explore why different age groups in MENA use ride-hailing services, from daily commutes to emergencies, with TGM StatBox's 2026 breakdown.
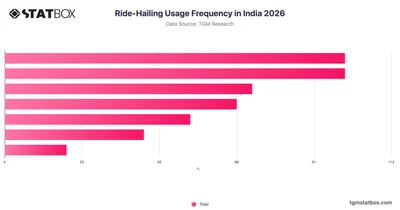
Explore how frequently Indians use ride-hailing services in 2026 with TGM StatBox, covering usage patterns from weekly riders to non-users across India.
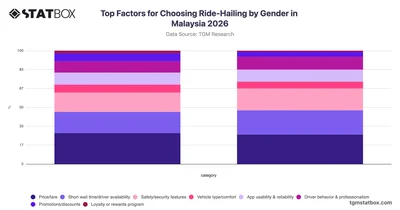
Explore how male and female riders in Malaysia differ in their ride-hailing service preferences with gender-segmented data from TGM StatBox.
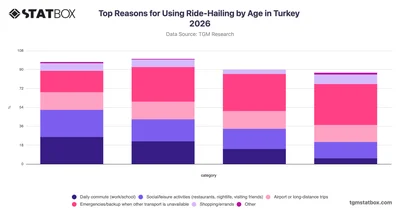
Discover how ride-hailing usage reasons vary across age groups in Turkey with TGM StatBox, covering commuting, leisure, emergencies, and more.
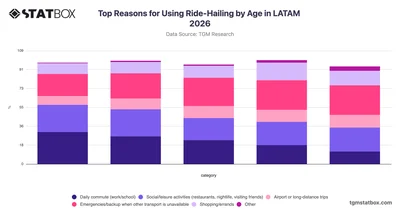
Explore how ride-hailing usage reasons vary across age groups in LATAM with TGM StatBox data covering commuting, leisure, emergencies, and more.
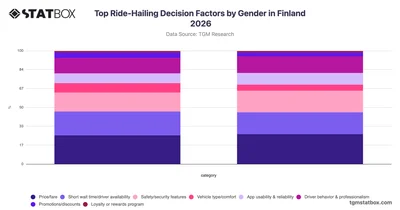
Compare how male and female riders in Finland prioritize ride-hailing decisions with gender-segmented data from TGM StatBox.
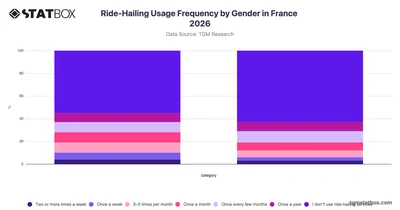
Explore ride-hailing usage frequency by gender in France with TGM StatBox, revealing how often men and women use these services in 2026.
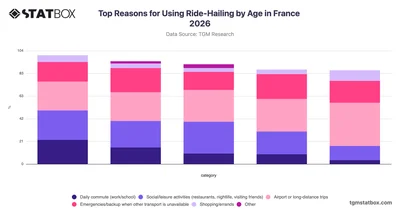
Explore how ride-hailing usage reasons vary across age groups in France with this TGM StatBox chart covering commuting, leisure, travel, and more.
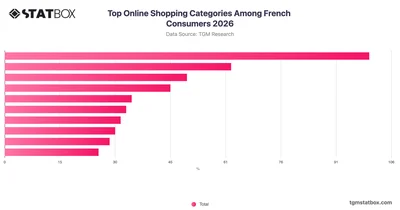
Explore TGM StatBox data on France's top online shopping categories in 2026, where clothing leads at 66% and footwear follows at 41%.
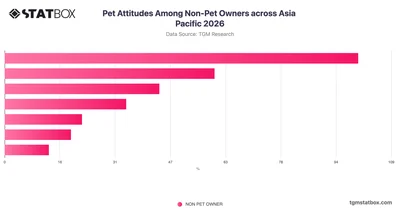
Explore pet attitudes among non-pet owners across Asia Pacific in 2026 with TGM StatBox, covering emotional stances from affection to indifference and aversion.
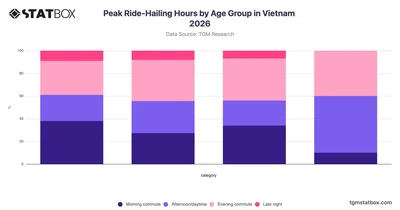
Explore peak ride-hailing hours across age groups in Vietnam with TGM StatBox, revealing how usage patterns shift throughout the day by generation.
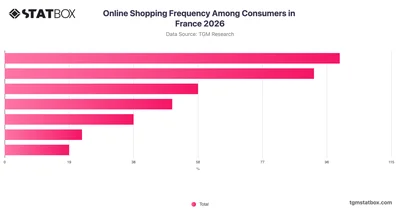
Explore France's online shopping frequency data on TGM StatBox: 26% shop 2–3 times a month, while 21% buy weekly or more often in 2026.
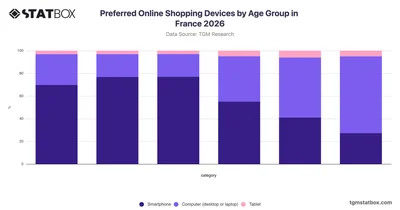
Explore TGM StatBox data on preferred online shopping devices by age in France 2026: younger adults favour smartphones while 65+ rely heavily on computers.
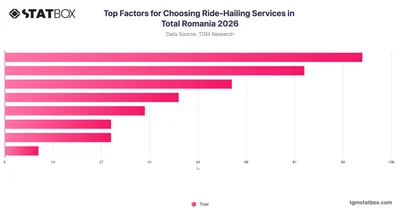
Identify what drives ride-hailing service choices in Romania with clear consumer preference data from TGM StatBox, covering price, safety, app usability, and more.
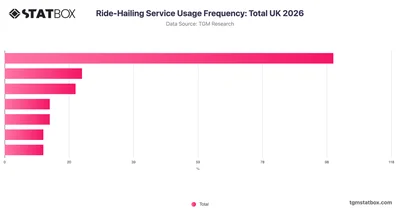
Discover how frequently UK consumers use ride-hailing services in 2026 with this TGM StatBox chart covering usage patterns from weekly riders to non-users.
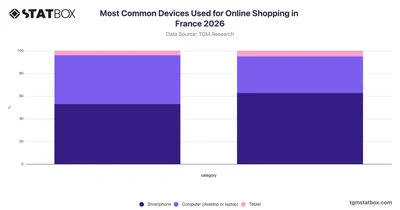
Explore TGM StatBox data on online shopping devices in France 2026: smartphones lead for both genders, with women (62%) outpacing men (53%).
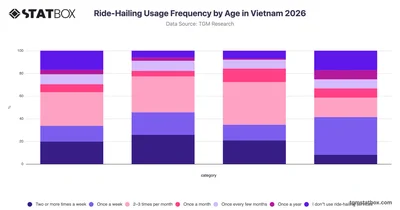
Explore ride-hailing usage frequency across age groups in Vietnam with 2026 data from TGM StatBox, revealing how often different generations use these services.
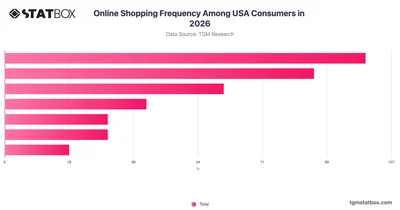
Explore USA online shopping frequency data from TGM StatBox — most consumers shop at least weekly, with monthly purchases also common among American buyers in 2026.
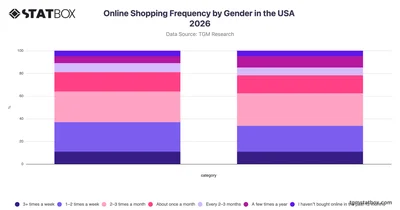
Explore 2026 USA online shopping frequency by gender on TGM StatBox — weekly shopping leads for both sexes, while women shop a few times a year more than men.
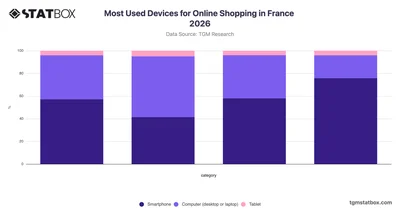
Explore France's 2026 online shopping device trends on TGM StatBox: smartphones lead at 56%, dominating among heavy users at 75%, while computers remain key for light shoppers.
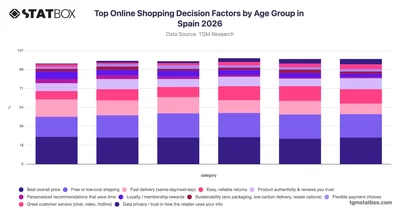
Explore TGM StatBox data on Spain's top online shopping decision factors in 2026, where price leads across all age groups and younger shoppers prioritize fast delivery.
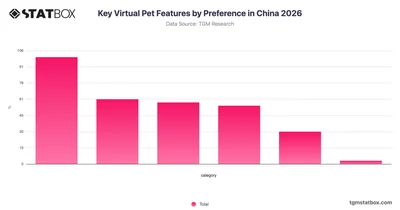
Explore key virtual pet features preferred by consumers in China with this TGM StatBox chart covering aspects like care needs, costs, and customization options.
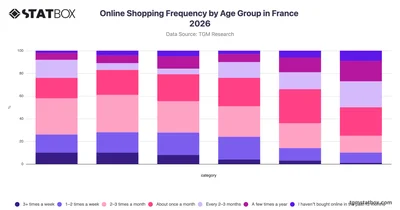
Explore France's 2026 online shopping frequency by age on TGM StatBox — 25–34s lead with weekly purchases, while 65+ shop mostly monthly or less.
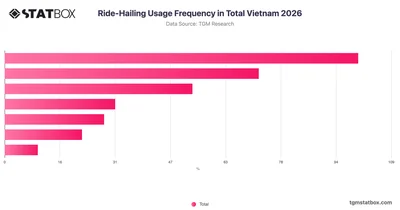
Explore ride-hailing usage frequency data for Vietnam in 2026, including how often people use these services, with TGM StatBox.
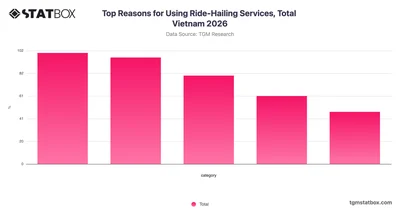
Explore why Vietnamese consumers turn to ride-hailing services in 2026 with this TGM StatBox chart covering key usage motivations across Vietnam.
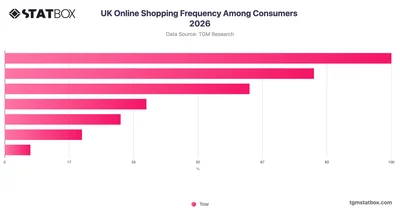
Explore UK online shopping frequency in 2026 with TGM StatBox — most consumers shop at least a few times a month, with weekly buyers making up a significant share.
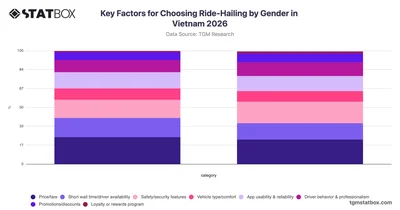
Explore how male and female riders in Vietnam prioritize different factors when choosing ride-hailing services, with full gender breakdowns on TGM StatBox.
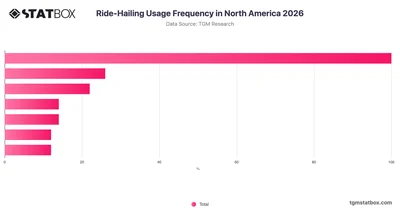
Explore ride-hailing usage frequency in North America with TGM StatBox, covering how often consumers use these services across key usage tiers.
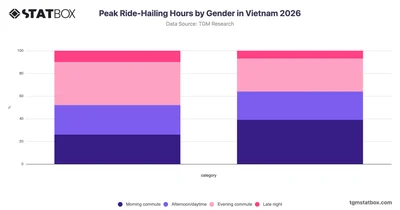
Explore how peak ride-hailing hours differ by gender in Vietnam with this TGM StatBox chart covering morning, daytime, evening, and late-night usage patterns.
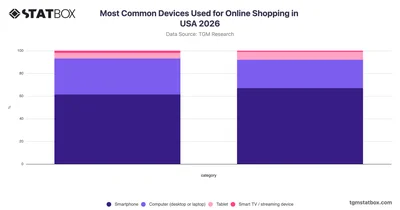
Explore TGM StatBox data on the most common devices used for online shopping in the USA, where smartphones dominate for both men and women, far ahead of computers.






