Insights library
Not sure where to start? Dive into a diverse selection of charts and data visualizations across topics, and find the information you need to drive your research and analysis.
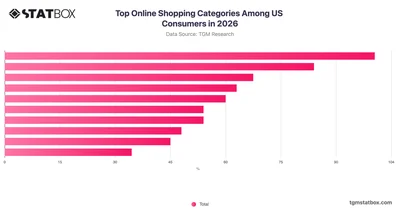

Explore TGM StatBox data on top online shopping categories in the USA, where clothing leads and groceries rank among the most purchased product types.
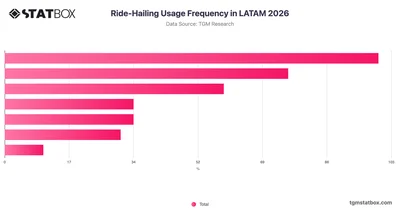
Explore ride-hailing usage frequency across LATAM in 2026 with TGM StatBox, covering how often consumers use these services throughout the region.
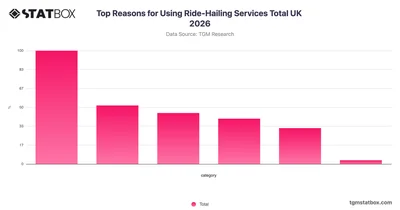
Discover why UK consumers use ride-hailing services in 2026 with TGM StatBox, covering key reasons from daily commutes to social and leisure activities.
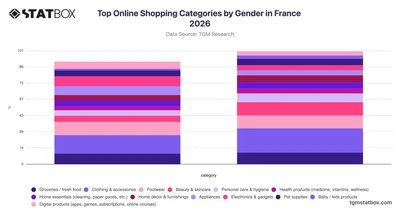
Explore TGM StatBox data on France's top online shopping categories by gender in 2026, where clothing leads for both sexes and electronics skew heavily male while beauty skews female.
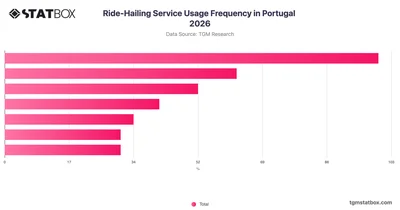
Explore how frequently people in Portugal use ride-hailing services in 2026 with clear survey data from TGM StatBox.
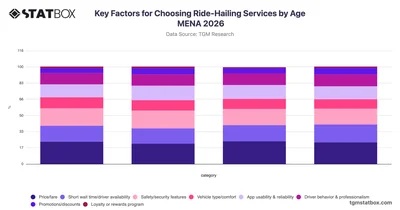
Explore how age shapes ride-hailing service preferences across MENA with TGM StatBox data on pricing, safety, wait times, and more.
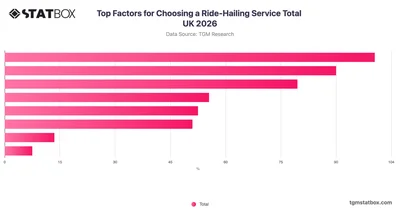
Discover what UK consumers prioritise when selecting a ride-hailing service with this TGM StatBox chart covering key decision factors across the UK in 2026.
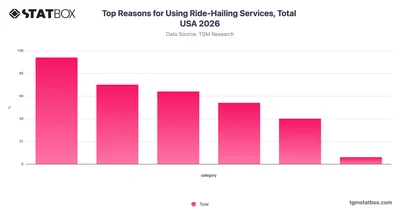
Explore why Americans use ride-hailing services in the USA with TGM StatBox, covering key motivations from daily travel to leisure and emergency needs.
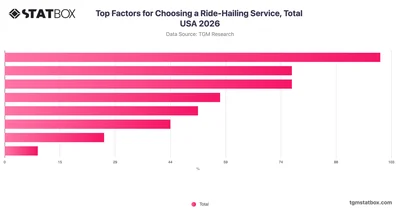
Explore what drives ride-hailing app choices among US consumers in 2026 with TGM StatBox data covering price, safety, wait times, and more.
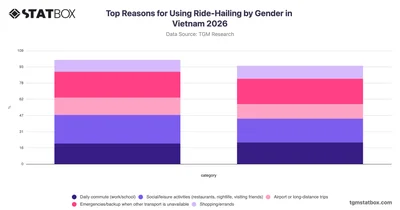
Explore why Vietnamese men and women use ride-hailing services in 2026, from daily commutes to leisure trips, with gender-segmented data on TGM StatBox.
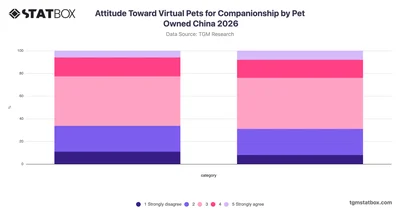
Explore attitudes toward virtual pets for companionship among cat and dog owners in China with this 2026 TGM StatBox chart showing opinion breakdowns by pet type.
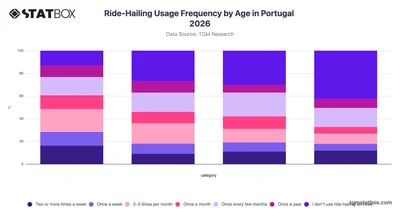
Explore how frequently different age groups in Portugal use ride-hailing services in 2026 with this TGM StatBox chart covering usage patterns across generations.
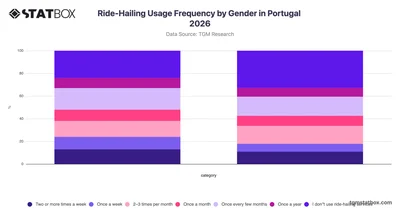
Explore ride-hailing usage frequency by gender in Portugal with TGM StatBox, revealing how often men and women use these services across different time intervals.
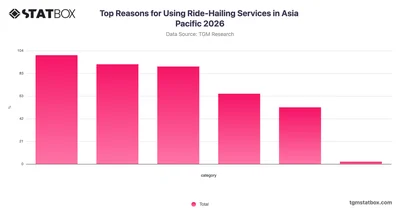
Explore why people across Asia Pacific use ride-hailing services, from daily commutes to emergencies, with TGM StatBox's 2026 regional data.
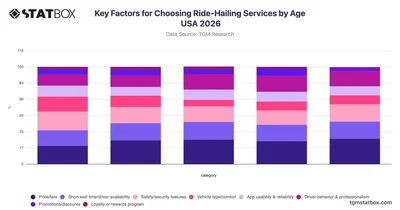
Explore how age shapes ride-hailing service priorities across the USA in 2026 with TGM StatBox data on key decision factors by generation.
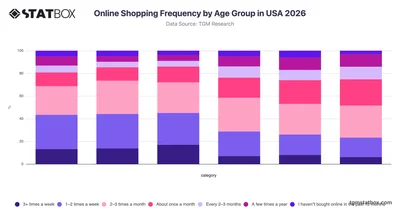
Explore USA online shopping frequency by age group with TGM StatBox — 35–44s shop most often weekly, while older adults tend to buy just once a month or less.
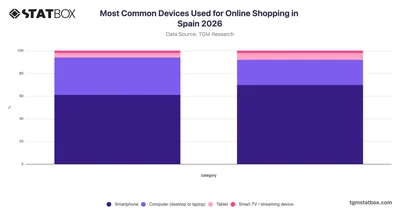
Explore TGM StatBox data on online shopping devices in Spain, where smartphones dominate for both genders while computers rank second among men.
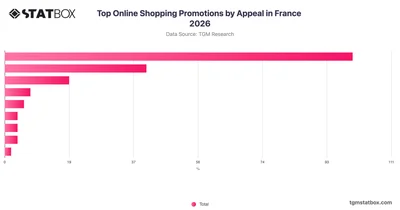
Explore TGM StatBox data on France's top online shopping promotions in 2026, where % off discounts lead at 54%, followed by free shipping at 22%.
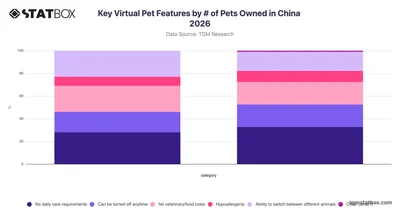
Explore how single and multi-pet owners in China value different virtual pet features with this TGM StatBox chart on key ownership preferences for 2026.
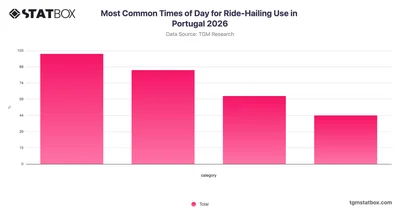
Explore how ride-hailing usage is distributed across different times of day in Portugal with this TGM StatBox chart covering 2026 data.
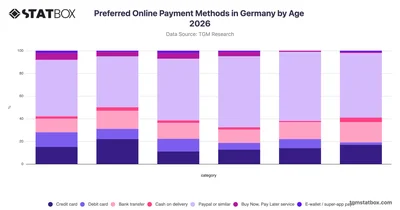
Explore TGM StatBox data on preferred online payment methods in Germany by age group in 2026, where PayPal dominates across all generations while younger users show stronger card adoption.
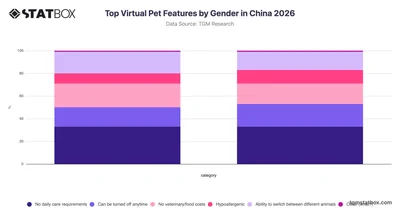
Explore how male and female consumers in China prioritize virtual pet features with gender-based data from TGM StatBox.
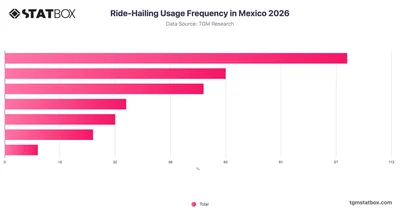
Explore ride-hailing usage frequency in Mexico with TGM StatBox, covering how often consumers use these services across a range of usage patterns.
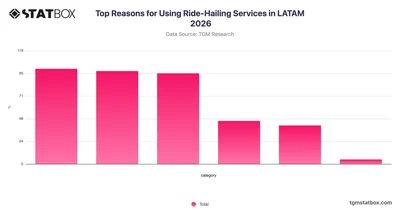
Explore why people in LATAM use ride-hailing services, from daily commutes to emergencies, with TGM StatBox data covering key usage motivations across the region.
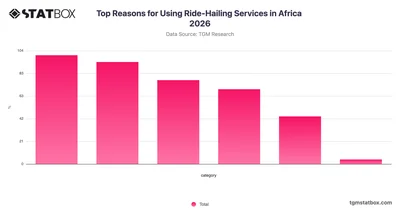
Explore why people across Africa use ride-hailing services in 2026 with TGM StatBox, covering commuting, leisure, emergencies, and more.
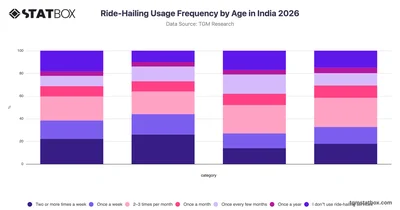
Explore how often different age groups in India use ride-hailing services in 2026 with this TGM StatBox chart covering weekly to yearly usage frequencies.
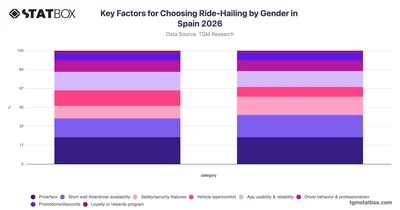
Discover how male and female users in Spain prioritize different factors when choosing ride-hailing services, with full gender breakdowns available on TGM StatBox.
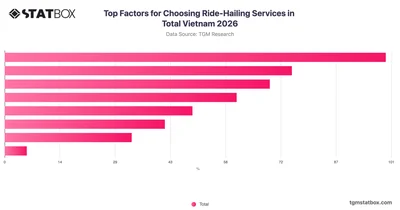
Explore what drives ride-hailing choices in Vietnam with TGM StatBox data covering key factors from pricing to safety and app experience.
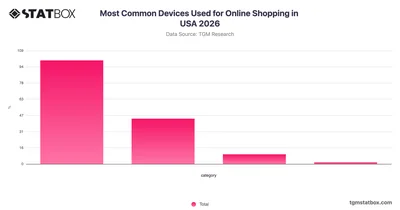
Smartphones dominate online shopping device usage in the USA, far ahead of computers and tablets, according to TGM StatBox 2026 data.
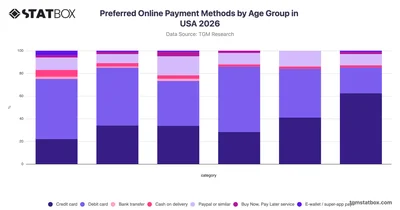
Explore preferred online payment methods by age group in the USA with TGM StatBox — older Americans favor credit cards while younger groups lean toward debit cards.






