Insights library
Not sure where to start? Dive into a diverse selection of charts and data visualizations across topics, and find the information you need to drive your research and analysis.
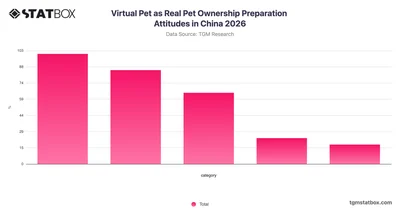

Explore how Chinese consumers view virtual pets as preparation for real pet ownership in this TGM StatBox chart covering attitudes across key response categories in China 2026.
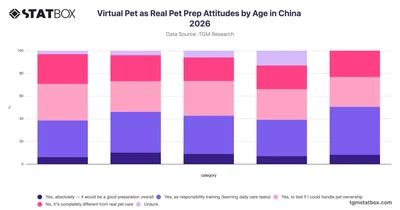
Explore how different age groups in China view virtual pets as preparation for real pet ownership with TGM StatBox's 2026 attitude breakdown.

Explore how people in China feel about emotional attachment to virtual or robotic pets with this 2026 TGM StatBox chart covering the full range of responses.
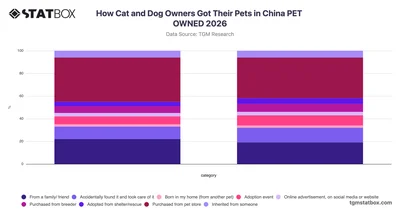
Explore how cat and dog owners in China acquired their pets in 2026 with TGM StatBox data covering sources from pet stores to shelters and personal networks.
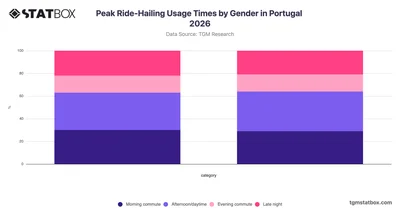
Explore ride-hailing peak usage times by gender in Portugal with TGM StatBox, covering morning, daytime, evening, and late-night patterns.
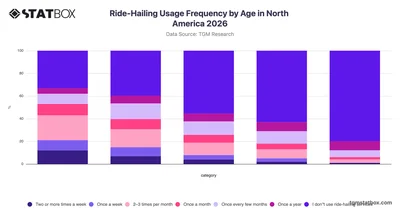
Explore how ride-hailing usage frequency varies across age groups in North America with this 2026 TGM StatBox chart covering weekly to yearly habits.
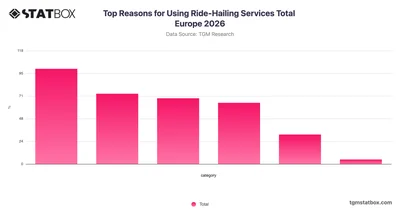
Explore why Europeans use ride-hailing services in 2026 with TGM StatBox, covering key reasons from daily commutes to social activities and emergencies.
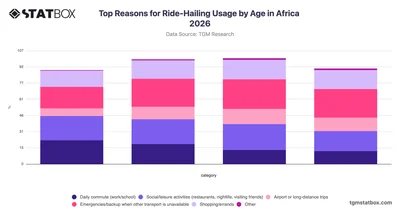
Explore how ride-hailing usage reasons vary across age groups in Africa with TGM StatBox data covering commuting, leisure, emergencies, and more.
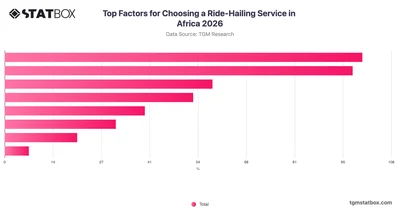
Explore what drives ride-hailing service choices across Africa in 2026 with TGM StatBox, covering key factors from pricing to safety and app reliability.
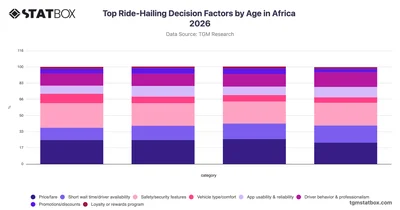
Compare ride-hailing decision factors across age groups in Africa with TGM StatBox, covering price, safety, wait times, and more.
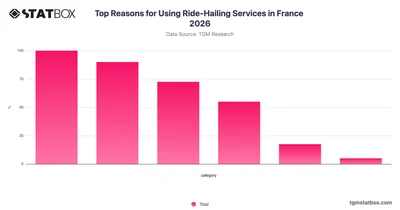
Explore why people in France use ride-hailing services with TGM StatBox data covering key reasons from daily commutes to leisure and emergency travel.
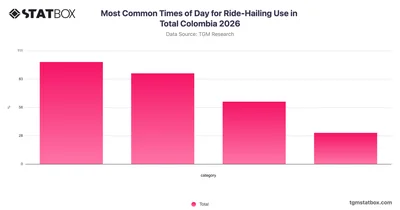
Explore how Colombians use ride-hailing services throughout the day with this TGM StatBox chart covering peak usage times across Colombia in 2026.
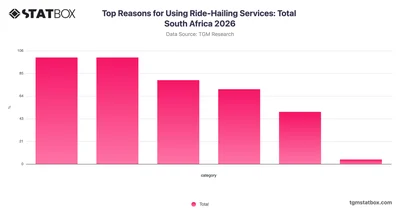
Discover why South Africans use ride-hailing services in 2026 with TGM StatBox data covering commuting, leisure, emergencies, and more.
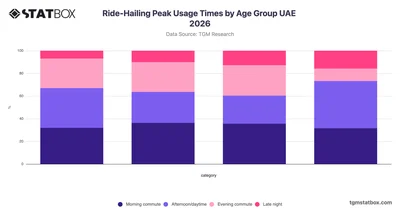
Compare ride-hailing peak usage times across age groups in the UAE with TGM StatBox, revealing how travel patterns shift between morning, afternoon, evening, and late night.
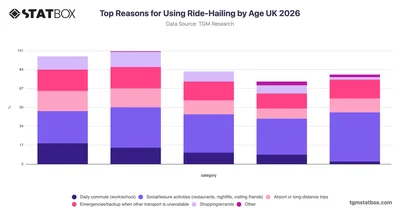
Discover how UK adults across age groups use ride-hailing services, from commuting to leisure, with TGM StatBox's 2026 breakdown by age.
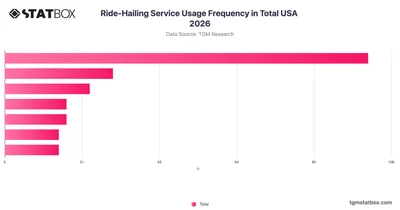
Explore 2026 data on how often Americans use ride-hailing services in the USA, broken down by frequency of use, with TGM StatBox.
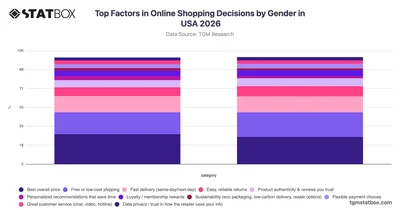
TGM StatBox reveals how US shoppers prioritize price above all in 2026, with men and women aligned on cost but split on shipping versus speed.
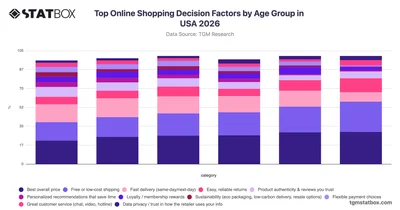
Explore TGM StatBox data on what drives online shopping in USA 2026, where price dominates across all ages while younger shoppers prioritize fast delivery over older generations.
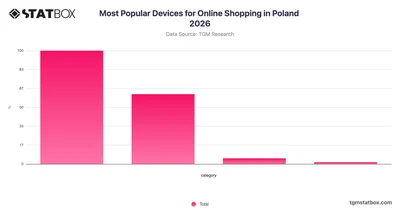
Explore TGM StatBox data on Poland's most popular online shopping devices in 2026, where smartphones dominate and computers trail far behind.
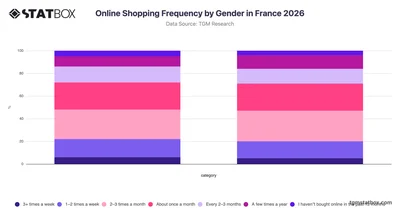
Explore 2026 French online shopping frequency by gender on TGM StatBox — most adults shop 2–3 times a month, with habits nearly identical between men and women in France.
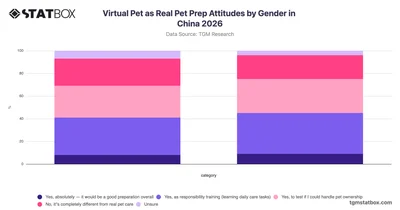
Explore how men and women in China view virtual pets as preparation for real pet ownership with gender-segmented survey data from TGM StatBox.
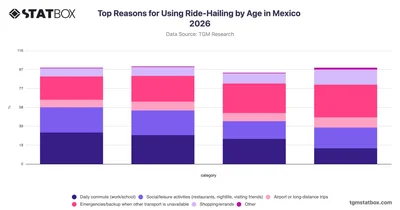
Explore why different age groups in Mexico use ride-hailing services with TGM StatBox data covering commuting, emergencies, leisure, and more.
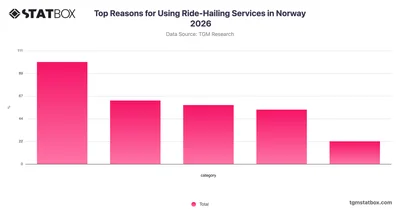
Explore why people in Norway use ride-hailing services, from commuting to leisure trips, with TGM StatBox data covering key usage motivations in 2026.
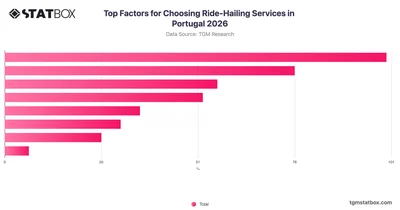
Explore the key factors influencing ride-hailing service choices in Portugal with this TGM StatBox chart covering price, safety, app usability, and more.
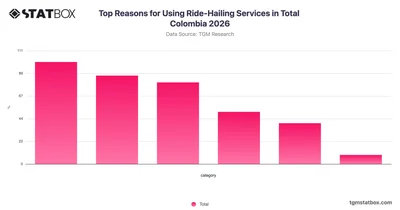
Explore the key reasons Colombians use ride-hailing services in 2026 with TGM StatBox, covering commuting, leisure, emergencies, and more.
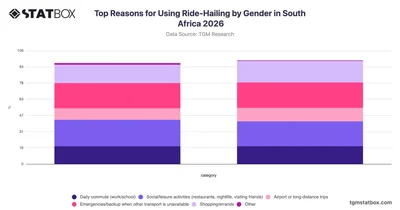
Discover how men and women in South Africa differ in their reasons for using ride-hailing services with this TGM StatBox gender breakdown chart for 2026.
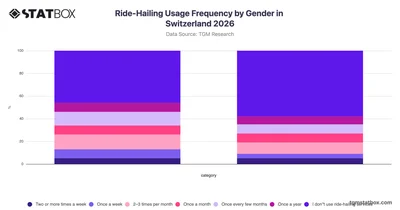
Discover how often men and women in Switzerland use ride-hailing services in 2026 with gender-segmented data from TGM StatBox.
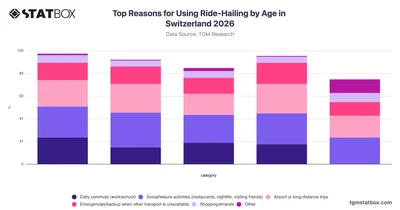
Discover how ride-hailing usage reasons vary across age groups in Switzerland with this TGM StatBox chart covering commuting, leisure, travel, and more.
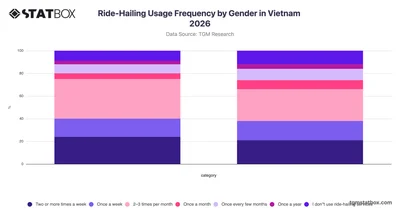
Explore ride-hailing usage frequency by gender in Vietnam with TGM StatBox, revealing how often men and women use these services in 2026.
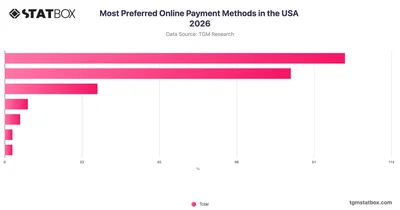
Debit and credit cards dominate online payment preferences in the USA — explore the full 2026 breakdown by method on TGM StatBox.






