Insights library
Not sure where to start? Dive into a diverse selection of charts and data visualizations across topics, and find the information you need to drive your research and analysis.
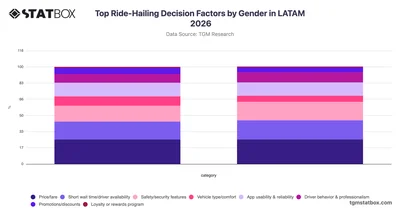

Explore how male and female riders in LATAM prioritize ride-hailing decisions with gender-segmented data from TGM StatBox.
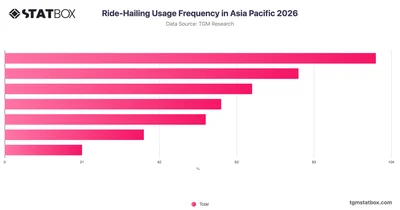
Explore ride-hailing usage frequency across Asia Pacific in 2026 with TGM StatBox, covering how often consumers use these services in the region.
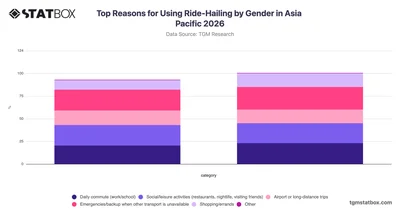
Explore how men and women across Asia Pacific differ in their reasons for using ride-hailing services with gender-segmented data on TGM StatBox.
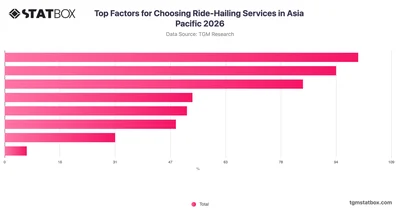
Explore what drives ride-hailing service choices across Asia Pacific in 2026 with TGM StatBox, covering key factors from pricing to app usability and safety.
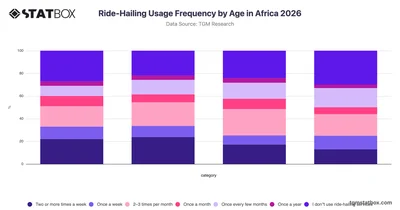
Explore ride-hailing usage frequency across age groups in Africa with TGM StatBox, covering how often different generations use these services in 2026.
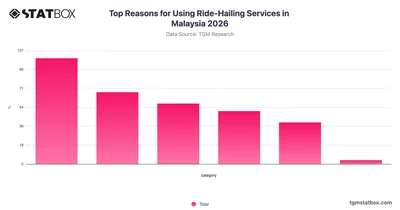
Explore why Malaysians use ride-hailing services in 2026 with TGM StatBox, covering key reasons from daily commutes to emergencies and leisure trips.
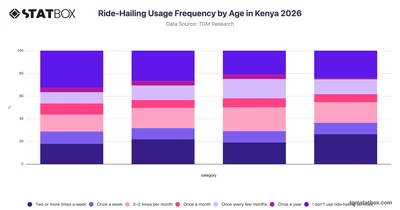
Explore ride-hailing usage frequency across age groups in Kenya with TGM StatBox, covering how often different generations use these services in 2026.
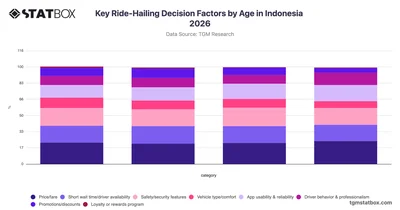
Explore how age shapes ride-hailing decision factors among Indonesian users in 2026 with clear survey data from TGM StatBox.
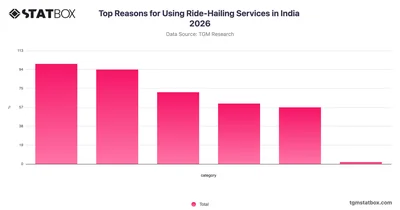
Explore why Indians use ride-hailing services in 2026, from daily commutes to leisure trips, with TGM StatBox data covering key usage motivations across India.
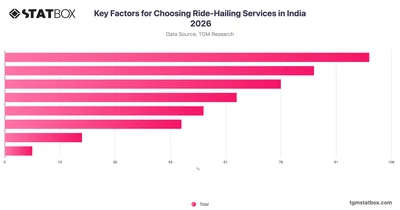
Explore what drives ride-hailing service choices in India with TGM StatBox data covering factors from pricing and safety to app usability and driver professionalism.
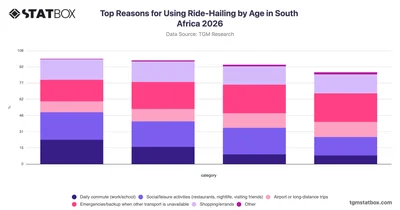
Discover how ride-hailing usage reasons vary across age groups in South Africa with TGM StatBox's 2026 breakdown by commuting, leisure, and emergency needs.
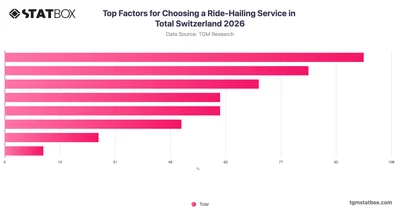
Discover what drives ride-hailing service choices in Switzerland with this TGM StatBox chart covering key factors from pricing to app usability and driver professionalism.
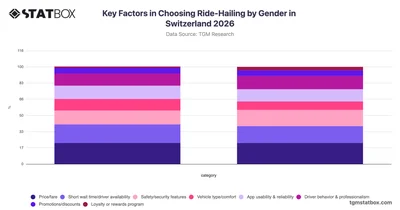
Discover how gender shapes ride-hailing preferences in Switzerland with TGM StatBox data covering key factors from pricing to safety and app reliability.
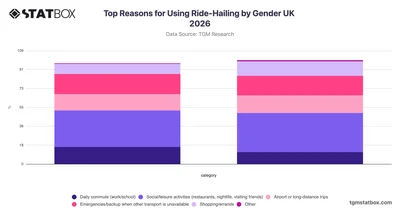
Discover how men and women in the UK differ in their reasons for using ride-hailing services with this TGM StatBox gender breakdown chart for 2026.
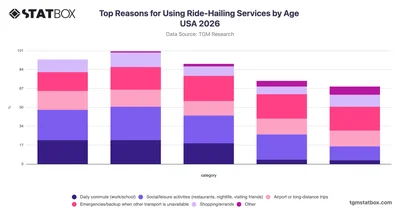
Explore why Americans across age groups use ride-hailing services in the USA with TGM StatBox's 2026 breakdown by generation and trip purpose.
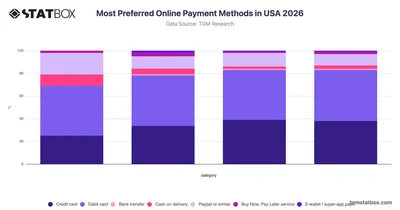
Explore USA online payment preferences by user type on TGM StatBox — debit cards lead across all groups, with credit cards dominating among heavy online shoppers.
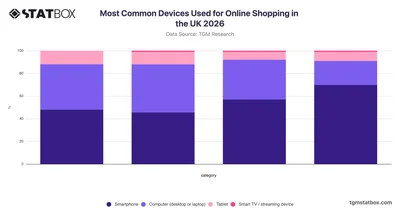
Explore TGM StatBox data on UK online shopping devices in 2026, where smartphones dominate among heavy users while computers lead for light and non-users.
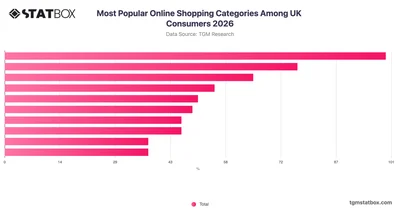
TGM StatBox reveals the most popular online shopping categories among UK consumers in 2026, with clothing topping the list and groceries also ranking among the leading choices.
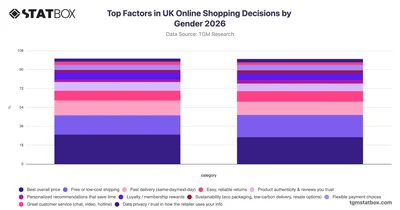
Explore TGM StatBox data on UK online shopping priorities by gender in 2026, where price leads for both sexes while women favour low-cost shipping over fast delivery.
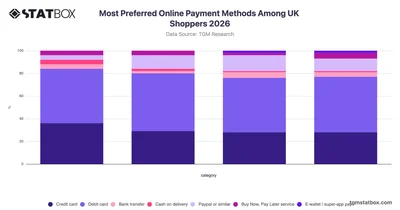
Debit cards dominate as the top payment choice for UK online shoppers across all user groups, with PayPal rising among heavy users — explore the full breakdown on TGM StatBox.
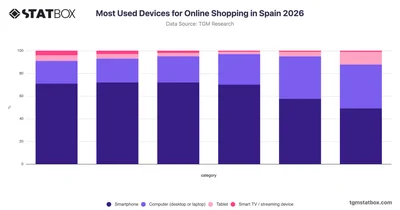
Explore TGM StatBox data on online shopping devices in Spain, where smartphones dominate across all ages while computers lead among older shoppers aged 65+.
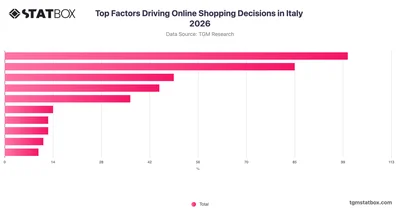
Explore TGM StatBox data on what drives online shopping in Italy, where best price and free shipping dominate consumer decisions above all other factors.
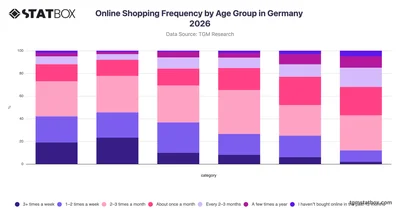
Explore online shopping frequency by age group in Germany with TGM StatBox — younger adults shop far more often, while older groups tend to buy monthly or less.
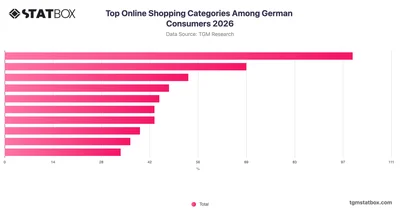
Explore TGM StatBox data on Germany's top online shopping categories in 2026, where clothing dominates and electronics rank among the most popular purchases.
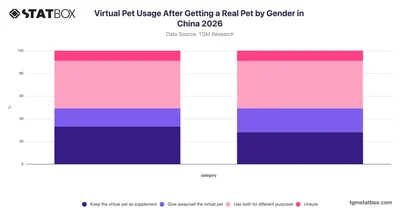
Explore how men and women in China plan to use virtual pets after getting a real one, with gender-based insights from TGM StatBox.
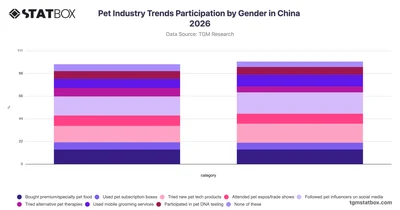
Explore how male and female pet owners in China engage with industry trends in 2026, from tech products to social media, with TGM StatBox gender-based data.
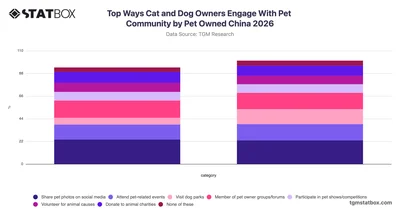
Explore how cat and dog owners in China engage with their pet communities, from social media to events, with TGM StatBox data for 2026.
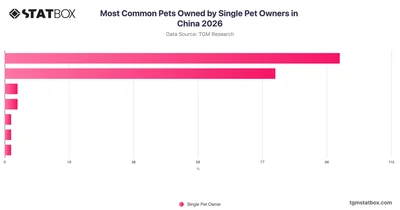
Explore the most common pets owned by single pet owners in China with this TGM StatBox chart covering dogs, cats, and more popular choices.
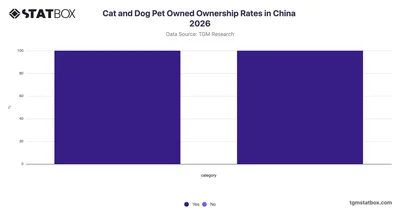
Explore cat and dog pet ownership rates in China with TGM StatBox, offering clear insights into how Chinese residents report owning cats and dogs.
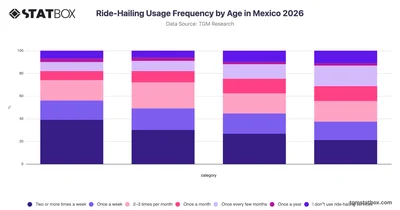
Explore how ride-hailing usage frequency varies across age groups in Mexico with this TGM StatBox chart covering adults from 18 to 65.






