Insights library
Not sure where to start? Dive into a diverse selection of charts and data visualizations across topics, and find the information you need to drive your research and analysis.
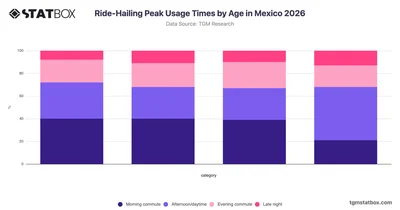

Explore how ride-hailing peak usage times vary across age groups in Mexico with this TGM StatBox chart covering morning, daytime, evening, and late-night patterns.
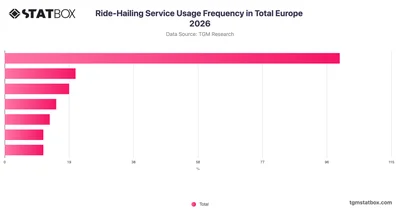
Explore how frequently Europeans use ride-hailing services in 2026 with this TGM StatBox chart covering usage patterns across Europe.
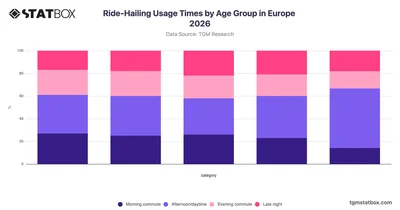
Explore how ride-hailing usage times vary across age groups in Europe with TGM StatBox, covering morning, daytime, evening, and late-night travel patterns.
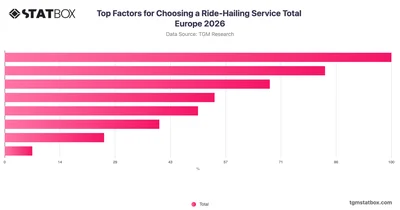
Explore what drives ride-hailing service choices across Europe with key consumer preference data from TGM StatBox, covering price, safety, app usability, and more.
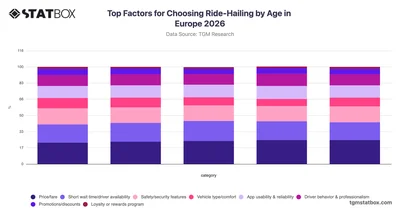
Explore the key factors driving ride-hailing choices across age groups in Europe with TGM StatBox's 2026 breakdown of consumer preferences.
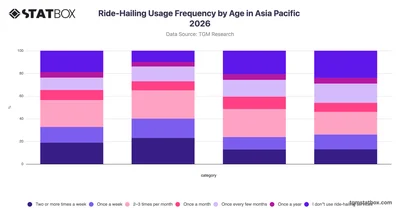
Explore ride-hailing usage frequency across age groups in Asia Pacific with TGM StatBox, covering how often different generations use these services in 2026.
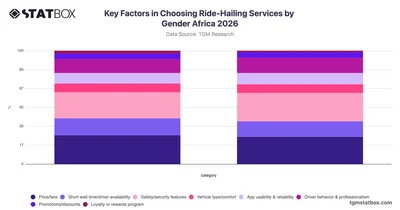
Explore how male and female riders in Africa prioritize factors when choosing ride-hailing services with gender-based data on TGM StatBox.
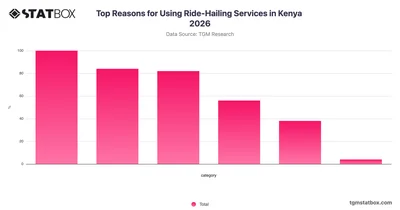
Explore why Kenyans use ride-hailing services in 2026 with TGM StatBox, covering key motivations from daily commutes to emergencies and leisure trips.
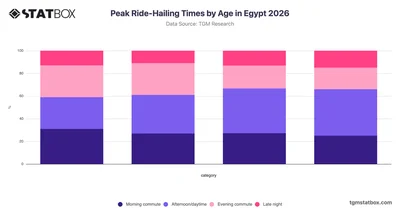
Explore how ride-hailing usage times vary across age groups in Egypt with this TGM StatBox chart covering morning, daytime, evening, and late-night patterns.
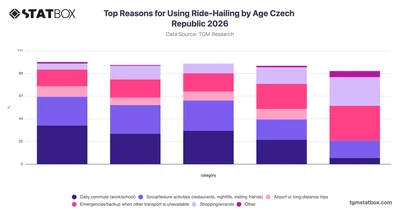
Explore how ride-hailing usage reasons vary across age groups in the Czech Republic with this TGM StatBox chart covering data from 2026.
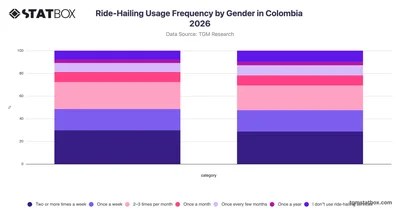
Explore ride-hailing usage frequency by gender in Colombia with TGM StatBox, revealing how often men and women use these services across various frequency levels.
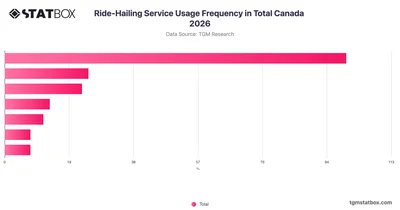
Explore how frequently Canadians use ride-hailing services in 2026 with TGM StatBox, covering usage patterns from weekly riders to non-users across Canada.
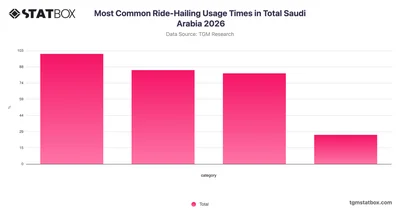
Discover how ride-hailing usage times vary across Saudi Arabia in 2026 with TGM StatBox, covering morning, daytime, evening, and late-night patterns.
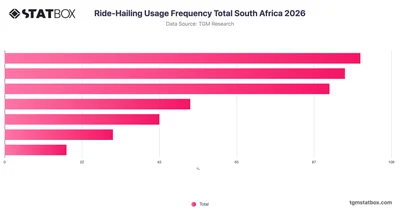
Discover how frequently South Africans use ride-hailing services in 2026 with TGM StatBox, covering usage patterns from regular riders to non-users.
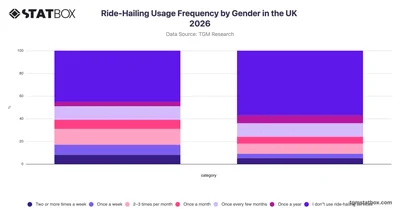
Discover how ride-hailing usage frequency differs by gender in the UK with this TGM StatBox chart covering everything from weekly riders to non-users.
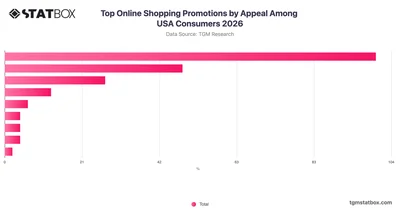
Percent-off discounts and free shipping dominate online shopping promotions by appeal among USA consumers in 2026, per TGM StatBox data.
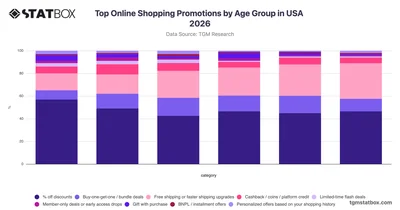
Explore TGM StatBox data on top online shopping promotions by age group in USA 2026, where percentage discounts lead across all ages and free shipping dominates among older shoppers.
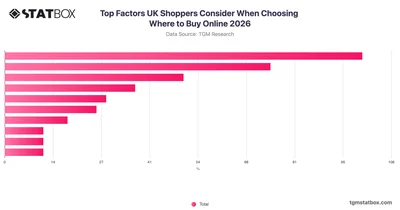
TGM StatBox reveals the top factors UK shoppers prioritize when choosing where to buy online in 2026, with price leading and shipping costs close behind.
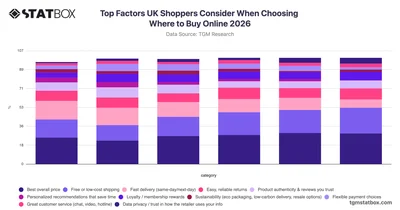
TGM StatBox reveals price and free shipping dominate UK online shopping decisions in 2026, with older shoppers prioritising cost and younger ones valuing fast delivery.
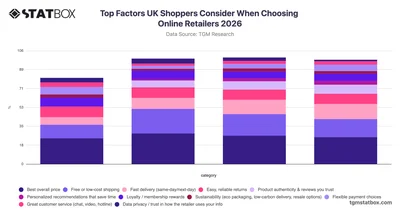
TGM StatBox reveals price and free shipping dominate UK online retailer choices in 2026, with heavy users prioritising fast delivery far more than non-users.
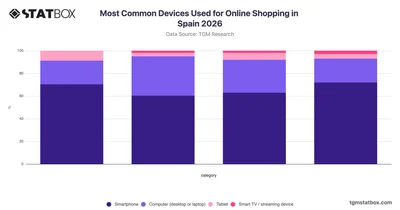
Explore TGM StatBox data on Spain's most-used online shopping devices in 2026, where smartphones dominate across all user groups and computers rank second.
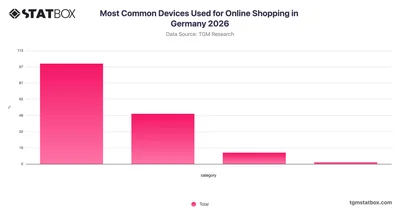
Explore TGM StatBox data on the most common devices used for online shopping in Germany, where smartphones dominate and computers trail far behind.
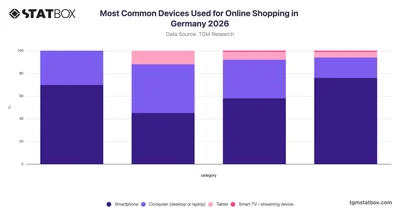
Explore the most used devices for online shopping in Germany by shopper type in 2026, from heavy online shoppers to less frequent users, on TGM StatBox.
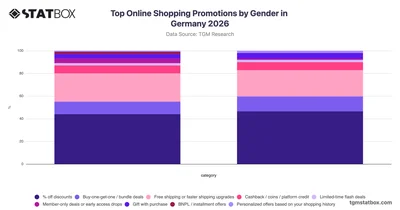
Explore TGM StatBox data on Germany's top online shopping promotions by gender in 2026, where percentage-off discounts and free shipping dominate for both men and women.
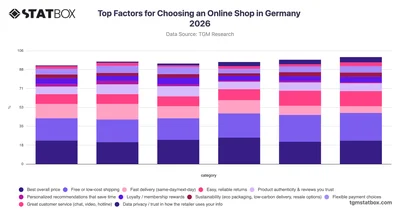
Explore TGM StatBox data on what drives online shop choices in Germany, where free shipping and competitive pricing dominate across all age groups.
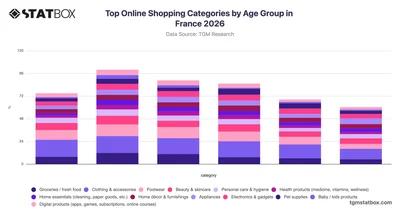
Explore TGM StatBox data on France's top online shopping categories by age group in 2026, where clothing dominates across all ages and groceries peak among 25–34s.
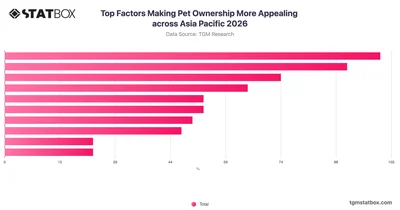
Explore what factors would make pet ownership more appealing across Asia Pacific in 2026, with regional insights from TGM StatBox.
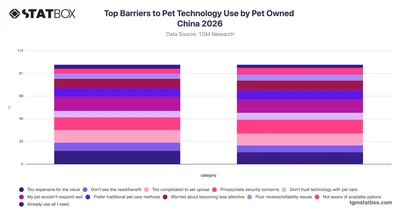
Explore the key barriers preventing cat and dog owners in China from adopting pet technology, with TGM StatBox data comparing attitudes across both owner groups.
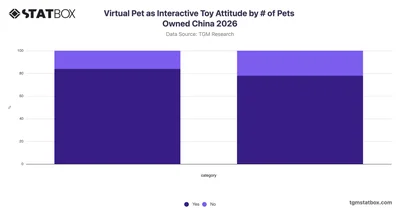
Compare how pet ownership numbers shape attitudes toward virtual pets as interactive toys in China with TGM StatBox data segmented by single and multi-pet owners.
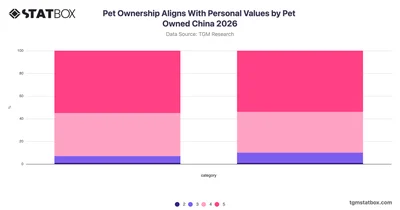
Explore how pet ownership aligns with personal values among cat and dog owners in China with data from TGM StatBox.






