Insights library
Not sure where to start? Dive into a diverse selection of charts and data visualizations across topics, and find the information you need to drive your research and analysis.
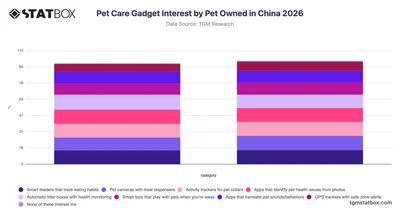

Explore pet care gadget interest among cat and dog owners in China with this 2026 TGM StatBox chart covering smart feeders, cameras, trackers, and more.
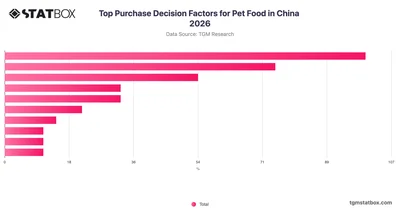
Explore what drives pet food purchase decisions in China with this TGM StatBox chart covering key factors from quality to ingredients and beyond.
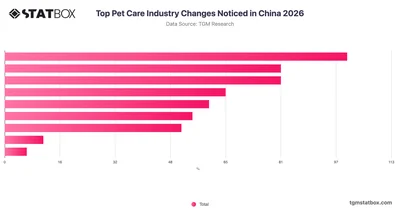
Explore how pet owners in China perceive industry changes in 2026, from services to technology, with TGM StatBox survey data.
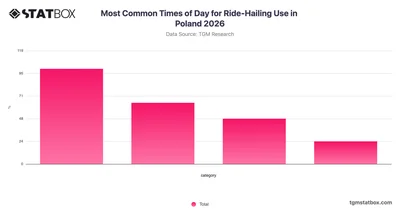
Explore how ride-hailing use is distributed across different times of day in Poland with this TGM StatBox chart covering 2026 data.
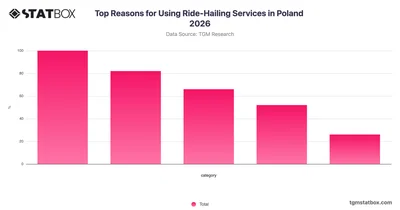
Explore why people in Poland use ride-hailing services, from commuting to leisure, with TGM StatBox data covering key motivations across the country.
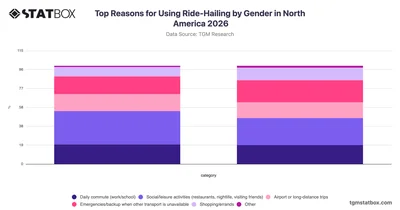
Explore how men and women in North America differ in their reasons for using ride-hailing services with gender-segmented data from TGM StatBox.
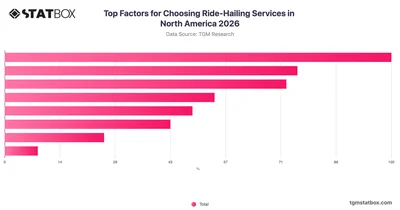
Explore what North American riders prioritize when choosing ride-hailing services, from pricing to safety, with data from TGM StatBox.
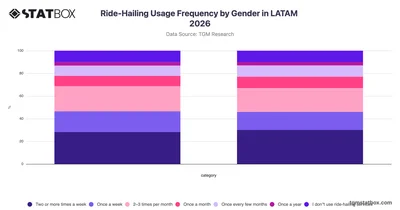
Explore ride-hailing usage frequency by gender across LATAM in 2026 with TGM StatBox, revealing how often men and women use these services.
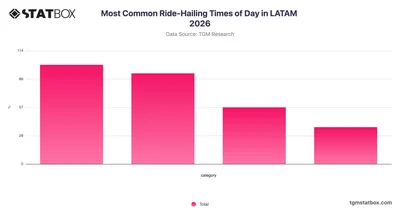
Explore ride-hailing usage patterns by time of day across LATAM in 2026 with TGM StatBox data on when people most commonly book rides.
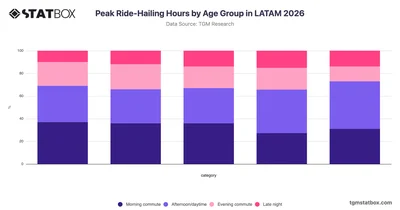
Explore how ride-hailing usage peaks at different times of day across age groups in LATAM with this TGM StatBox chart for 2026.
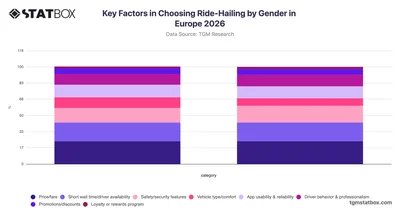
Explore how male and female riders in Europe prioritize factors when choosing ride-hailing services, with gender breakdowns on key criteria, via TGM StatBox.
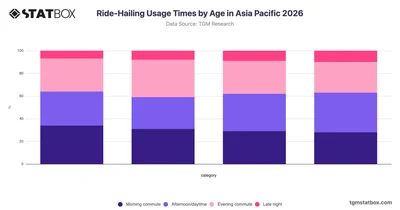
Explore how ride-hailing usage times vary across age groups in Asia Pacific with this 2026 TGM StatBox chart covering morning, daytime, evening, and late-night patterns.
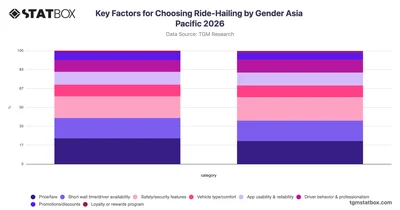
Compare how male and female riders in Asia Pacific prioritize factors when choosing ride-hailing services, with gender-segmented data on TGM StatBox.
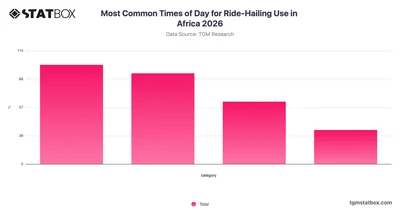
Explore how ride-hailing usage is distributed across times of day in Africa with this 2026 TGM StatBox chart covering morning, afternoon, evening, and late-night patterns.
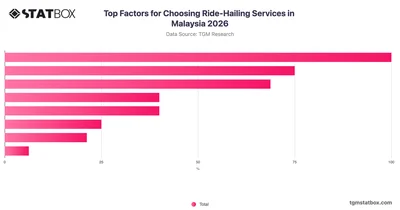
Explore what drives ride-hailing service choices among Malaysian consumers in 2026 with key insights and data on TGM StatBox.
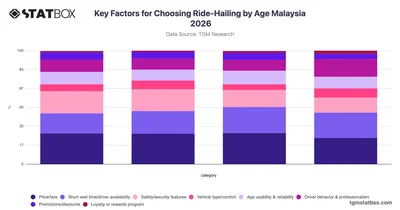
Explore how age shapes ride-hailing service priorities among Malaysian consumers in 2026 with clear demographic breakdowns on TGM StatBox.
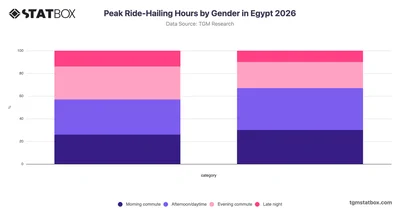
Compare ride-hailing peak hour patterns by gender in Egypt with TGM StatBox, covering morning, daytime, evening, and late-night usage differences.
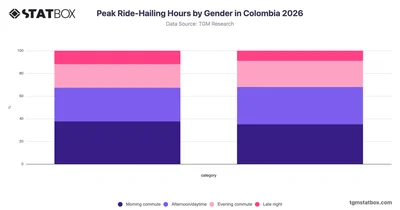
Compare ride-hailing peak hour patterns by gender in Colombia with TGM StatBox, covering morning, daytime, evening, and late-night usage trends.
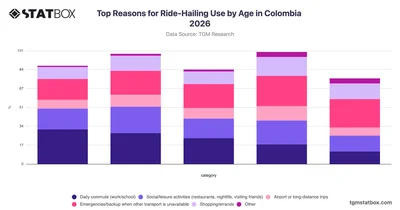
Explore how ride-hailing usage reasons vary across age groups in Colombia with this TGM StatBox chart covering commuting, leisure, emergencies, and more.
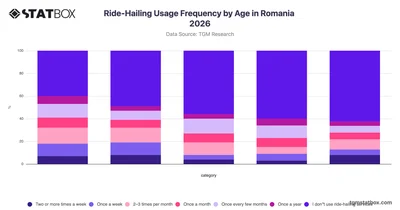
Compare ride-hailing usage frequency across age groups in Romania with TGM StatBox data covering everything from weekly riders to non-users.
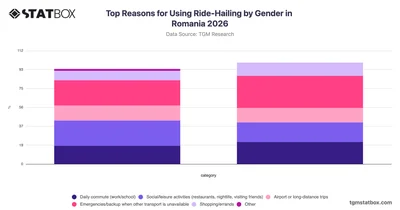
Compare how men and women in Romania use ride-hailing services across key trip purposes with gender-segmented data from TGM StatBox.
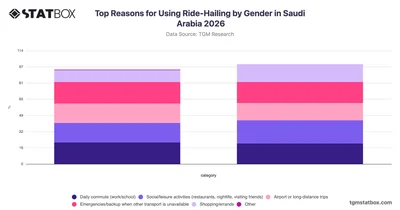
Discover how men and women in Saudi Arabia differ in their reasons for using ride-hailing services with gender-segmented data from TGM StatBox.
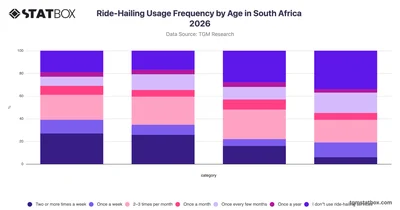
Discover how ride-hailing usage frequency varies across age groups in South Africa with TGM StatBox's 2026 survey data.
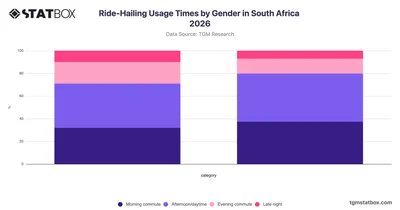
Compare ride-hailing usage times by gender in South Africa with TGM StatBox, covering morning, daytime, evening, and late-night travel patterns.
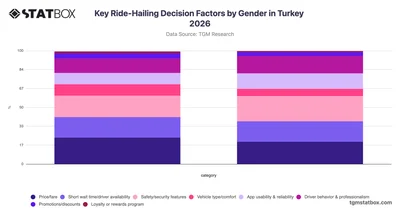
Compare how male and female riders in Turkey prioritize ride-hailing decision factors, from safety to pricing, with gender-segmented data on TGM StatBox.
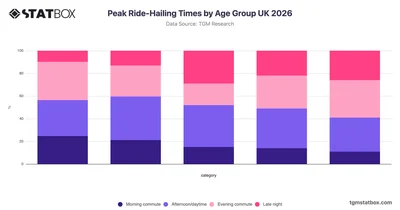
Discover how ride-hailing usage times vary across age groups in the UK with this TGM StatBox chart breaking down peak travel periods from morning to late night.
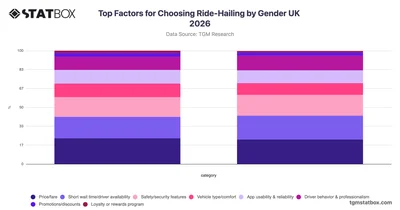
Compare how male and female riders in the UK prioritise factors when choosing ride-hailing services, with gender-split data available on TGM StatBox.
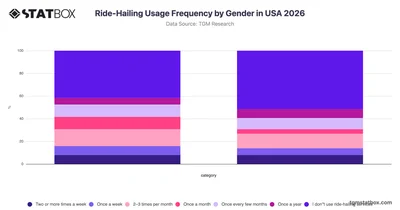
Explore ride-hailing usage frequency by gender in the USA with TGM StatBox, covering how often men and women use these services in 2026.
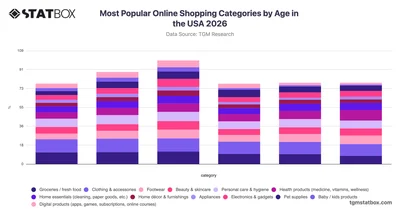
Explore TGM StatBox data on the most popular online shopping categories in the USA, where clothing leads across all ages and health products top the list for older shoppers.
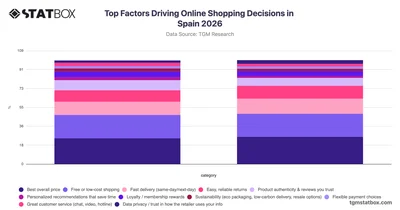
Explore TGM StatBox data on what drives online shopping in Spain, where price tops the list for both genders, followed closely by free or low-cost shipping.






