Insights library
Not sure where to start? Dive into a diverse selection of charts and data visualizations across topics, and find the information you need to drive your research and analysis.
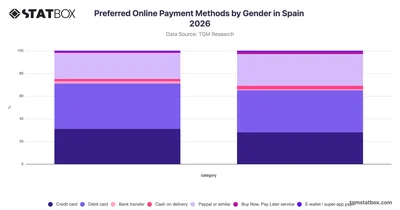

Explore preferred online payment methods by gender in Spain via TGM StatBox — debit cards lead for both, while women favour PayPal more than men.
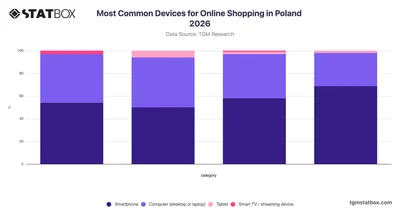
Explore TGM StatBox data on Poland's most-used online shopping devices in 2026, where smartphones lead across all user groups while computers remain a strong second choice.
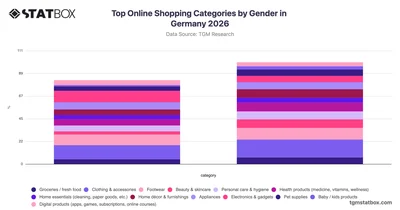
Explore TGM StatBox data on Germany's top online shopping categories by gender in 2026, where clothing dominates for both sexes and electronics skew heavily male while beauty favors women.
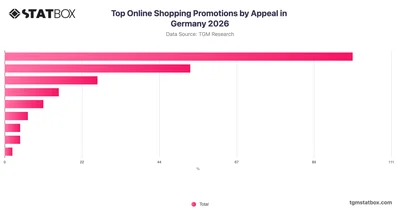
Explore which online shopping promotions appeal most to German consumers in 2026 with TGM StatBox, where discounts dominate and free shipping ranks second.
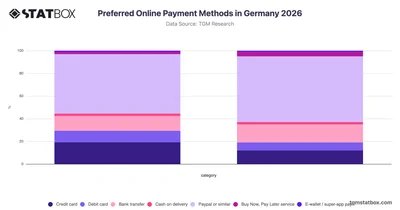
Explore Germany's preferred online payment methods in 2026 with TGM StatBox, where PayPal dominates across genders and credit cards lead among male shoppers.
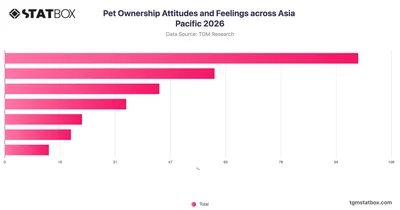
Explore pet ownership attitudes and feelings across Asia Pacific in 2026 with TGM StatBox, covering emotional connections, preferences, and barriers to pet ownership.
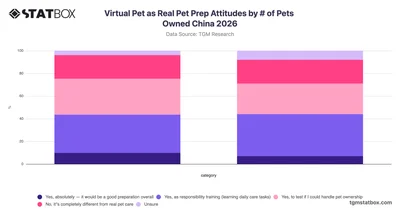
Explore how Chinese pet owners with single or multiple pets view virtual pets as preparation for real pet care in this TGM StatBox chart for China 2026.
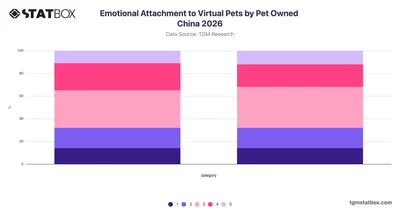
Explore emotional attachment to virtual pets among cat and dog owners in China with this 2026 TGM StatBox chart covering key sentiment levels.
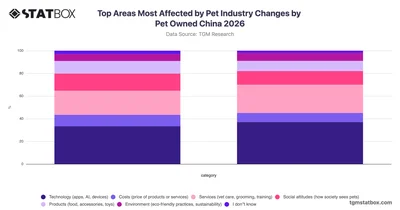
Explore how pet industry changes affect cat and dog owners across key areas in China with data from TGM StatBox.
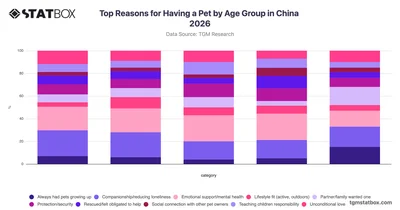
Explore why people across age groups in China own pets with this TGM StatBox chart breaking down motivations from companionship to emotional support.
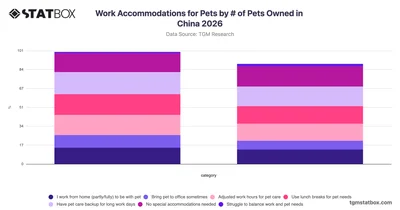
Compare work accommodations for pets by number of pets owned in China with this TGM StatBox chart covering schedules, remote work, and pet care arrangements.
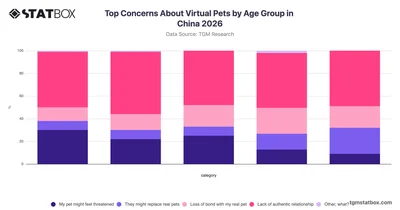
Explore how different age groups in China view virtual pet concerns with TGM StatBox data breaking down attitudes from young adults to older generations.
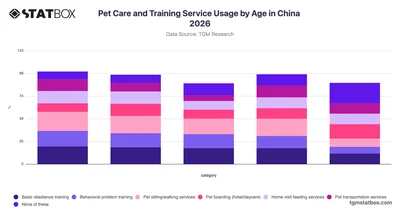
Explore how pet care and training service usage varies across age groups in China with this TGM StatBox chart covering 2026 consumer data.
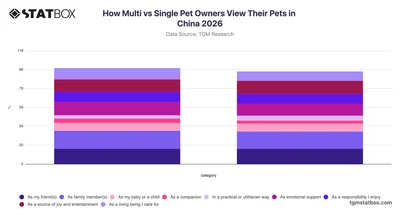
Compare how multi-pet and single-pet owners in China perceive their pets across emotional and practical roles with TGM StatBox data for 2026.
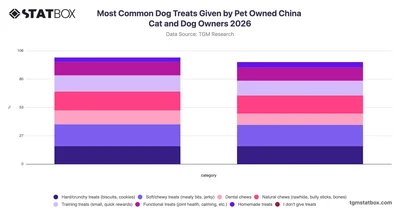
Explore the most common dog treats given by cat and dog owners in China with this TGM StatBox chart covering treat types from soft chews to functional and homemade options.
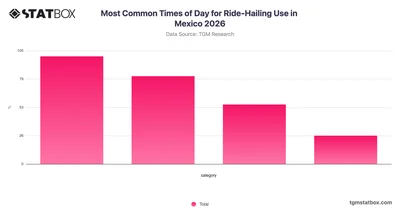
Explore how ride-hailing usage in Mexico is distributed across different times of day with this TGM StatBox chart covering 2026 data.
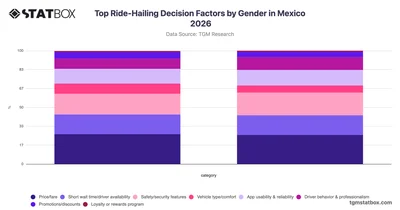
Compare how male and female riders in Mexico prioritize ride-hailing decisions with gender-segmented data from TGM StatBox.
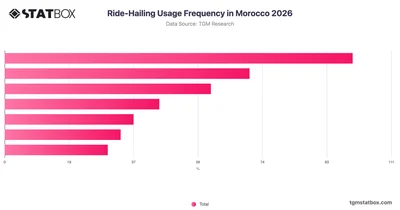
Explore ride-hailing usage frequency in Morocco with TGM StatBox, covering how often people use these services across a range of usage patterns.
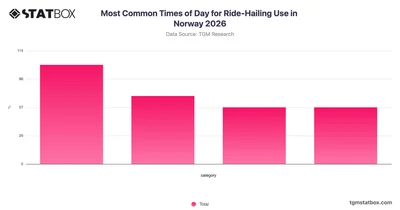
Explore how Norwegians use ride-hailing services throughout the day with this TGM StatBox breakdown of peak usage times across Norway in 2026.
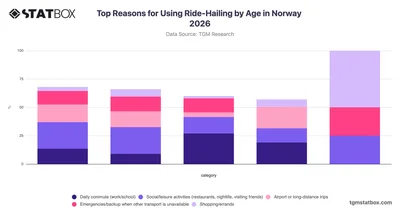
Explore how ride-hailing usage reasons vary across age groups in Norway with TGM StatBox data covering commuting, leisure, errands, and more.
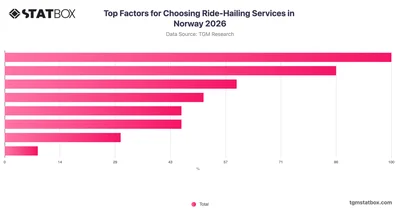
Explore what drives ride-hailing service choices in Norway with this TGM StatBox chart covering key factors like price, wait time, safety, and more.
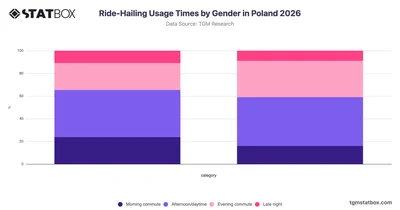
Compare ride-hailing usage times by gender in Poland with TGM StatBox, revealing how men and women differ in when they choose to book rides.
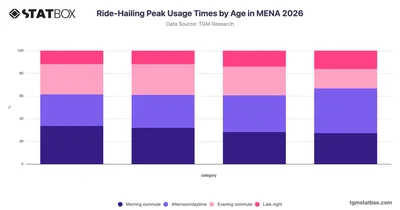
Explore how ride-hailing peak usage times vary across age groups in MENA with this TGM StatBox chart covering morning, daytime, evening, and late-night patterns.
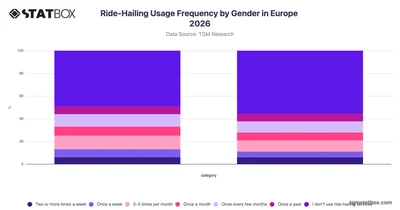
Explore ride-hailing usage frequency by gender across Europe in 2026 with TGM StatBox, covering how often men and women use these services.
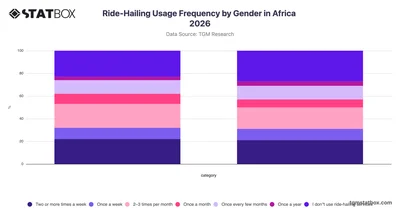
Explore ride-hailing usage frequency by gender across Africa in 2026 with TGM StatBox, covering how often men and women use these services.
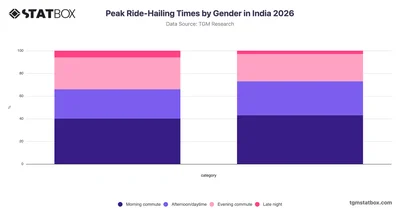
Compare peak ride-hailing times by gender in India with TGM StatBox, revealing how men and women differ in their preferred hours for booking rides.
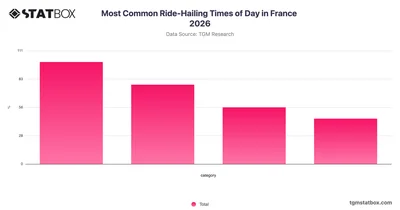
Explore how ride-hailing usage is distributed across different times of day in France with this TGM StatBox chart covering 2026 survey data.
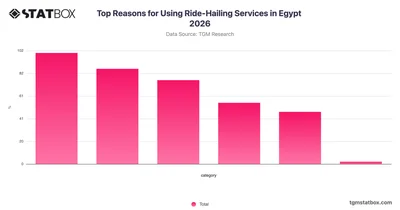
Explore why Egyptians use ride-hailing services in 2026, from daily commutes to emergencies, with TGM StatBox Egypt consumer data.
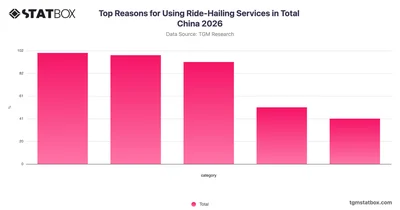
Explore why people in China use ride-hailing services, from daily commutes to leisure trips, with TGM StatBox data covering key usage motivations in 2026.
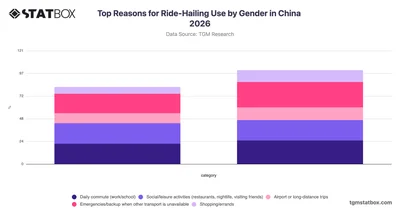
Compare why men and women use ride-hailing services in China across key trip types with gender-segmented data from TGM StatBox.






