Insights library
Not sure where to start? Dive into a diverse selection of charts and data visualizations across topics, and find the information you need to drive your research and analysis.
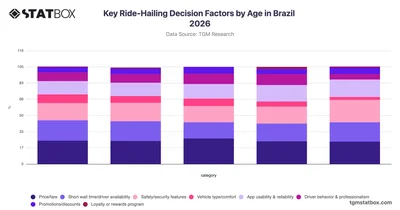

Explore how age shapes ride-hailing decision factors in Brazil with TGM StatBox data covering price, safety, app usability, and more across five age groups.
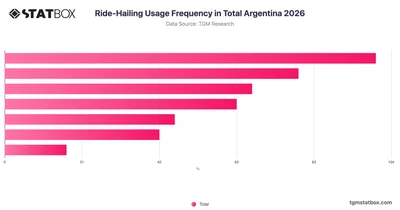
Explore ride-hailing usage frequency in Argentina with TGM StatBox, covering how often people use these services across a range of usage patterns.
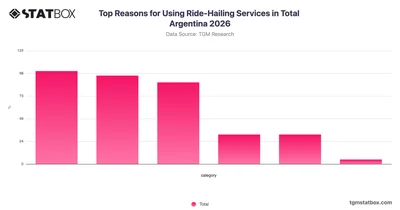
Explore why Argentinians use ride-hailing services in 2026, from daily commutes to emergencies, with TGM StatBox data covering key usage reasons in Argentina.
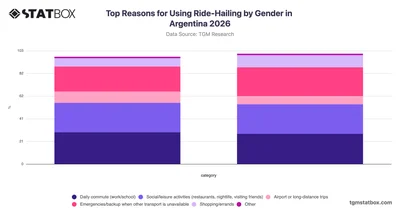
Explore how men and women in Argentina differ in their reasons for using ride-hailing services with this TGM StatBox gender breakdown chart for 2026.
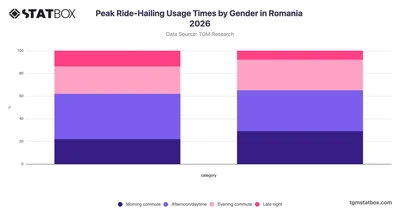
Compare ride-hailing peak usage times by gender in Romania with this TGM StatBox chart covering morning, daytime, evening, and late-night travel patterns.
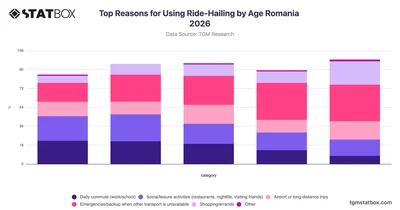
Compare why different age groups in Romania use ride-hailing services, from daily commutes to emergencies, with TGM StatBox's 2026 breakdown.
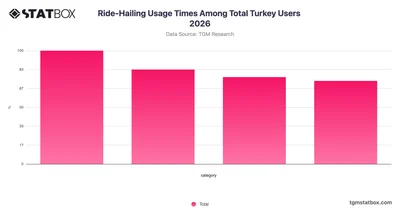
Discover how ride-hailing usage times are distributed among users in Turkey with this 2026 TGM StatBox chart covering key periods throughout the day.
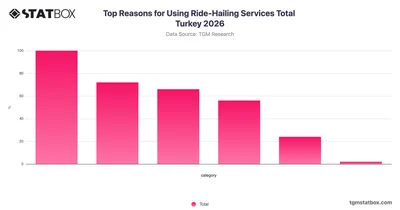
Discover why people in Turkey use ride-hailing services in 2026 with TGM StatBox, covering key reasons from daily commutes to emergencies and leisure trips.
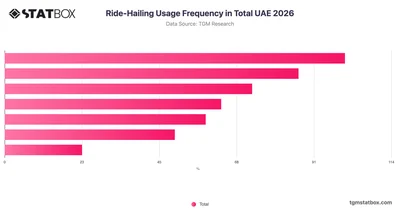
Discover how frequently UAE residents use ride-hailing services in 2026 with real survey data from TGM StatBox, covering usage patterns across the UAE.
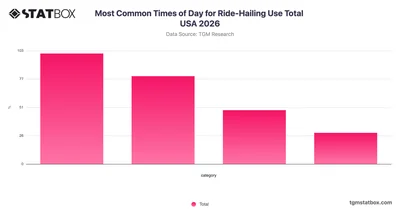
Explore when Americans most commonly use ride-hailing services throughout the day with this USA 2026 breakdown from TGM StatBox.
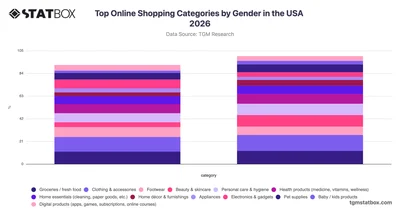
Explore TGM StatBox data on top online shopping categories by gender in the USA, where women lead in beauty and clothing while men dominate electronics.
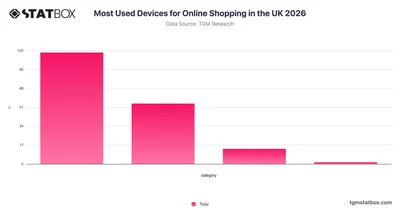
Smartphones dominate online shopping device usage in the UK, far ahead of computers and tablets, according to TGM StatBox data for 2026.
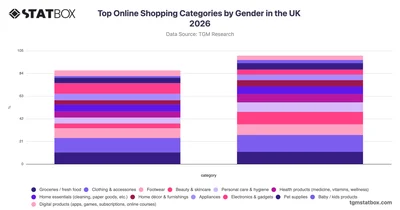
TGM StatBox reveals UK online shopping category preferences by gender in 2026, with women leading in beauty and clothing while men dominate electronics purchases.
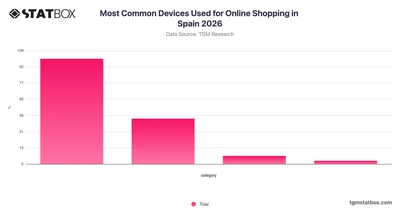
Smartphones dominate online shopping device usage in Spain, far ahead of computers and tablets, according to TGM StatBox data for 2026.
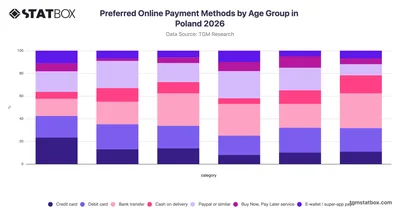
Explore preferred online payment methods by age group in Poland 2026 on TGM StatBox — bank transfers lead among older adults while younger groups favor PayPal and credit cards.
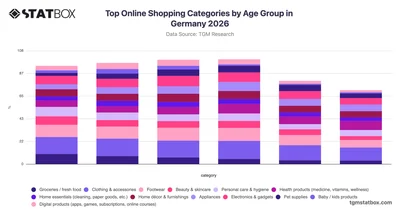
Explore TGM StatBox data on Germany's top online shopping categories by age group in 2026, where clothing dominates across all ages while younger shoppers lead in groceries and beauty.
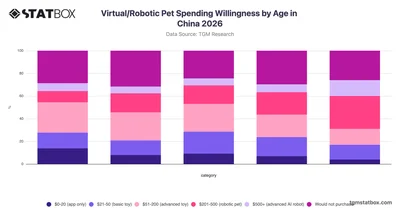
Explore how spending willingness on virtual and robotic pets varies across age groups in China with this TGM StatBox chart covering 2026 consumer data.
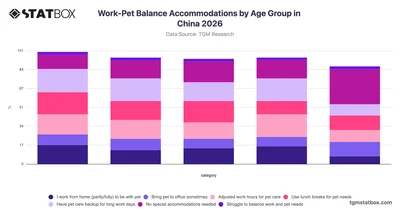
Explore how pet owners across age groups in China adapt their work habits for pet care with TGM StatBox's 2026 work-pet balance accommodations data.
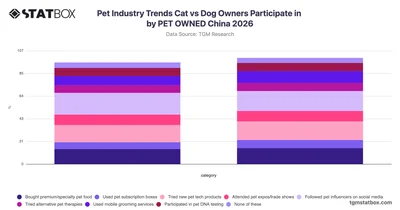
Compare pet industry trends among cat and dog owners in China with TGM StatBox, covering behaviors from pet tech to social media and grooming services.
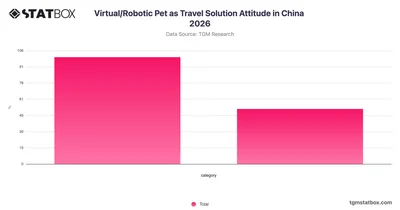
Explore how Chinese consumers feel about virtual and robotic pets as a travel solution in 2026 with real survey data from TGM StatBox.
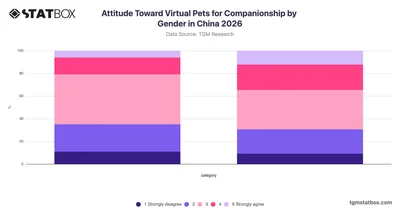
Compare how men and women in China feel about virtual pets as companions in 2026 with gender-based survey data from TGM StatBox.
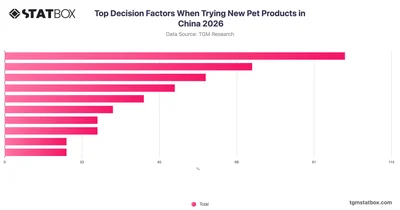
Explore what drives Chinese pet owners to try new products with this TGM StatBox chart covering key decision factors shaping pet product choices in China 2026.
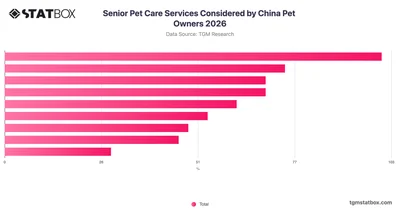
Explore how China pet owners approach senior pet care services in 2026, from vet visits to dietary needs, with data from TGM StatBox.
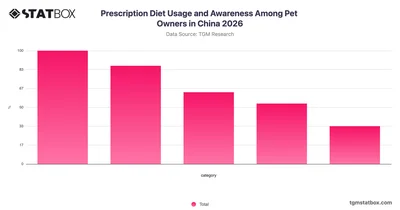
Explore pet owner awareness and usage of prescription diets in China with this 2026 TGM StatBox chart covering attitudes from current users to those unfamiliar with the concept.
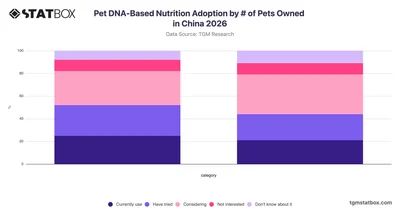
Explore how pet DNA-based nutrition adoption varies by number of pets owned in China with this TGM StatBox chart covering awareness, usage, and interest levels.
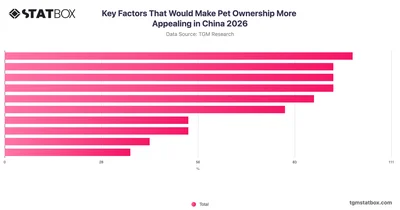
Explore what would make pet ownership more appealing in China with TGM StatBox data covering housing, costs, work flexibility, and care technology.
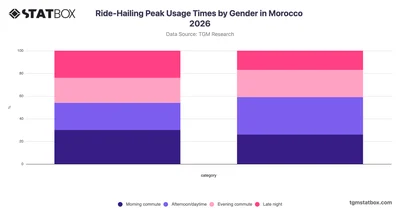
Compare ride-hailing peak usage times by gender in Morocco with TGM StatBox, revealing how men and women differ in their preferred travel hours.
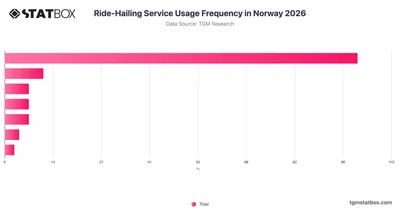
Explore how frequently people in Norway use ride-hailing services in 2026 with this TGM StatBox chart covering a range of usage patterns.
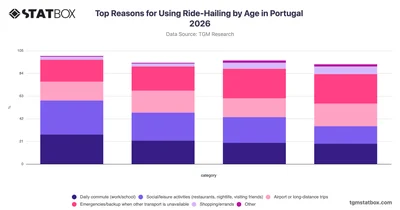
Explore why different age groups in Portugal use ride-hailing services, from commuting to leisure, with TGM StatBox's 2026 breakdown by generation.
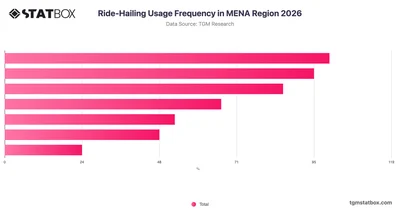
Explore ride-hailing usage frequency across MENA in 2026 with TGM StatBox, covering how often consumers use these services throughout the region.






