Insights library

Comprehensive Charts and Data Visualizations

Not sure where to start? Dive into a diverse selection of charts and data visualizations across topics, and find the information you need to drive your research and analysis.

6149 charts in the library · browse by filter, or search above
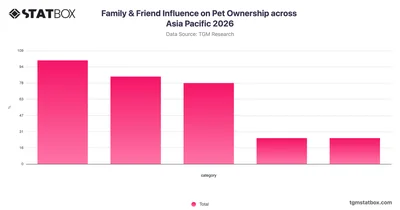
Family & Friend Influence on Pet Ownership across Asia Pacific 2026 Premium

Family & Friend Influence on Pet Ownership across Asia Pacific 2026

Explore how family and friend influence shapes pet ownership decisions across Asia Pacific in 2026 with data from TGM StatBox.
Asia Pacific Pet Care Published 2026
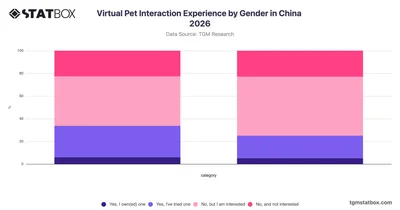
Virtual Pet Interaction Experience by Gender in China 2026 Premium

Virtual Pet Interaction Experience by Gender in China 2026

Explore how men and women in China differ in their virtual pet interaction experience with this TGM StatBox gender breakdown chart for 2026.
China Pet Care Published 2026
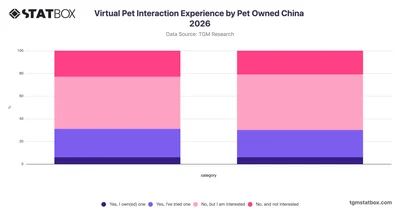
Virtual Pet Interaction Experience by Pet Owned China 2026 Premium

Virtual Pet Interaction Experience by Pet Owned China 2026

Explore virtual pet interaction experience among cat and dog owners in China with this 2026 TGM StatBox chart covering ownership, trial, and interest levels.
China Pet Care Published 2026
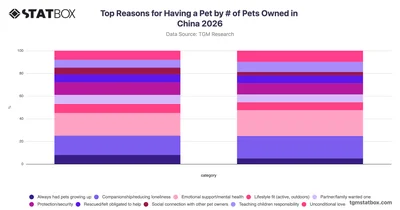
Top Reasons for Having a Pet by Number of Pets Owned in China 2026 Premium

Top Reasons for Having a Pet by Number of Pets Owned in China 2026

Compare why single and multi-pet owners in China choose to have pets with this TGM StatBox chart covering key motivations across ownership groups in 2026.
China Pet Care Published 2026
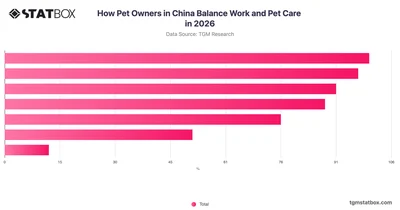
How Pet Owners in China Balance Work and Pet Care in 2026 Premium

How Pet Owners in China Balance Work and Pet Care in 2026

Explore how pet owners in China adapt their work routines for pet care in 2026 with real survey data from TGM StatBox.
China Pet Care Published 2026
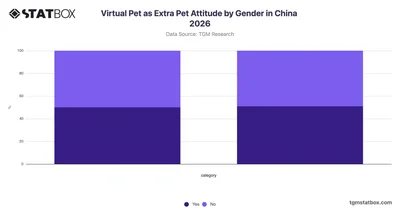
Virtual Pet as Extra Pet Attitude by Gender in China 2026 Premium

Virtual Pet as Extra Pet Attitude by Gender in China 2026

Explore how men and women in China view virtual pets as an extra pet in 2026 with gender-based data from TGM StatBox.
China Pet Care Published 2026
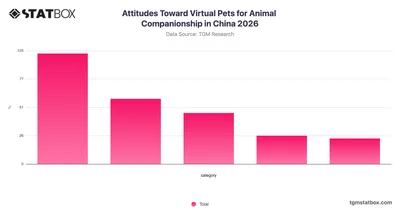
Attitudes Toward Virtual Pets for Animal Companionship in China 2026 Premium

Attitudes Toward Virtual Pets for Animal Companionship in China 2026

Explore attitudes toward virtual pets as a form of animal companionship in China with this TGM StatBox chart covering a range of consumer opinions.
China Pet Care Published 2026
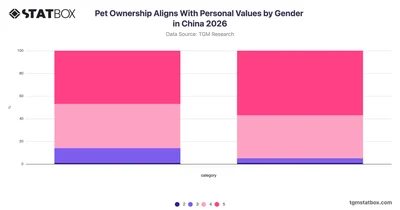
Pet Ownership Aligns With Personal Values by Gender in China 2026 Premium

Pet Ownership Aligns With Personal Values by Gender in China 2026

Explore how pet ownership aligns with personal values across genders in China with TGM StatBox, offering clear insights into male and female perspectives.
China Pet Care Published 2026
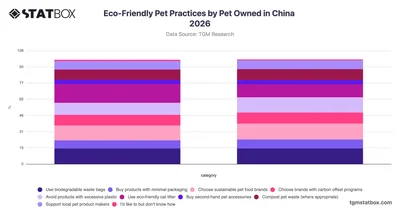
Eco-Friendly Pet Practices by Pet Owned in China 2026 Premium

Eco-Friendly Pet Practices by Pet Owned in China 2026

Explore eco-friendly pet practices among cat and dog owners in China with this TGM StatBox chart covering sustainability habits and purchasing behaviors in 2026.
China Pet Care Published 2026
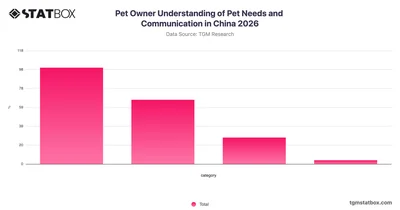
Pet Owner Understanding of Pet Needs and Communication in China 2026 Premium

Pet Owner Understanding of Pet Needs and Communication in China 2026

Explore how well pet owners in China understand their pets' needs and communication signals with this TGM StatBox chart covering 2026 survey data.
China Pet Care Published 2026
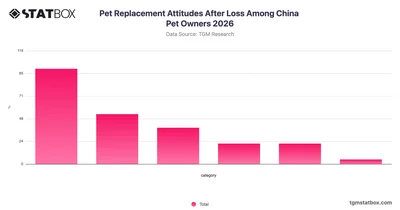
Pet Replacement Attitudes After Loss Among China Pet Owners 2026 Premium

Pet Replacement Attitudes After Loss Among China Pet Owners 2026

Explore pet replacement attitudes after loss among China pet owners with this TGM StatBox chart covering the full range of responses from definite intent to emotional hesitation.
China Pet Care Published 2026
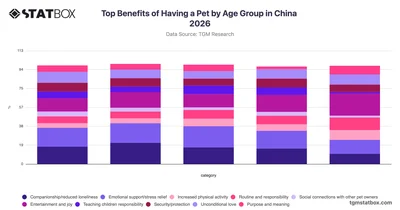
Top Benefits of Having a Pet by Age Group in China 2026 Premium

Top Benefits of Having a Pet by Age Group in China 2026

Explore how pet ownership benefits vary across age groups in China with TGM StatBox data covering emotional, social, and lifestyle advantages by generation.
China Pet Care Published 2026
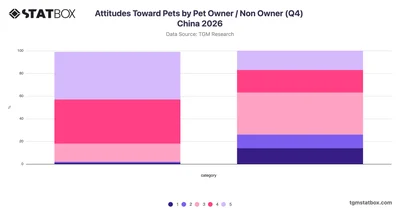
Attitudes Toward Pets by Pet Owner / Non Owner (Q4) China 2026 Premium

Attitudes Toward Pets by Pet Owner / Non Owner (Q4) China 2026

Compare attitudes toward pets among pet owners and non-owners in China with TGM StatBox, revealing how opinions differ across this 2026 five-point scale survey.
China Pet Care Published 2026
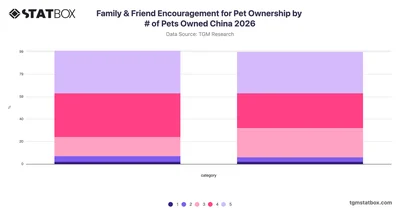
Family & Friend Encouragement for Pet Ownership by # of Pets Owned China 2026 Premium

Family & Friend Encouragement for Pet Ownership by # of Pets Owned China 2026

Explore how family and friend encouragement shapes pet ownership decisions in China, comparing single and multi-pet owners, with TGM StatBox.
China Pet Care Published 2026
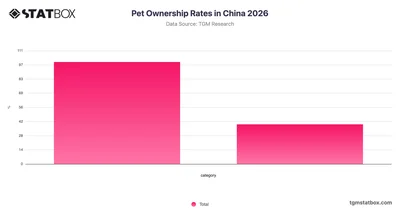
Pet Ownership Rates in China 2026 Premium

Pet Ownership Rates in China 2026

Explore pet ownership rates among the total population in China with up-to-date 2026 data, available on TGM StatBox.
China Pet Care Published 2026
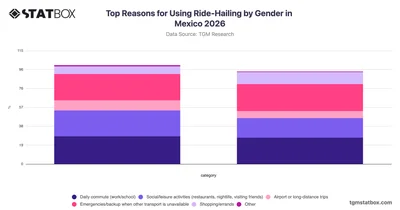
Top Reasons for Using Ride-Hailing by Gender in Mexico 2026 Premium

Top Reasons for Using Ride-Hailing by Gender in Mexico 2026

Explore why people in Mexico use ride-hailing services, broken down by gender, with TGM StatBox data covering commuting, leisure, emergencies, and more.
Mexico Ride-hailing Published 2026
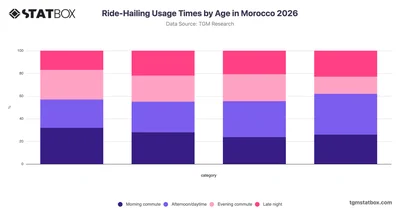
Ride-Hailing Usage Times by Age in Morocco 2026 Premium

Ride-Hailing Usage Times by Age in Morocco 2026

Explore how ride-hailing usage times vary across age groups in Morocco with this TGM StatBox chart covering morning, daytime, evening, and late-night patterns.
Morocco Ride-hailing Published 2026
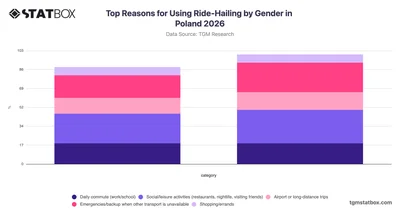
Top Reasons for Using Ride-Hailing by Gender in Poland 2026 Premium

Top Reasons for Using Ride-Hailing by Gender in Poland 2026

Compare how men and women in Poland use ride-hailing services across key trip purposes with this TGM StatBox gender breakdown chart for 2026.
Poland Ride-hailing Published 2026
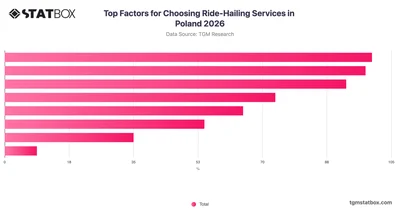
Top Factors for Choosing Ride-Hailing Services in Poland 2026 Premium

Top Factors for Choosing Ride-Hailing Services in Poland 2026

Explore the key factors Polish consumers consider when choosing ride-hailing services in Poland with TGM StatBox's 2026 survey data.
Poland Ride-hailing Published 2026
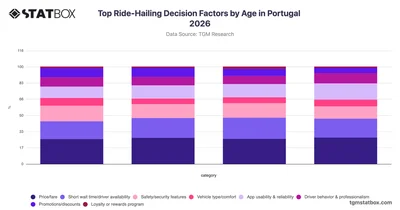
Top Ride-Hailing Decision Factors by Age in Portugal 2026 Premium

Top Ride-Hailing Decision Factors by Age in Portugal 2026

Explore how ride-hailing decision factors vary across age groups in Portugal with TGM StatBox's 2026 breakdown of key consumer priorities.
Portugal Ride-hailing Published 2026
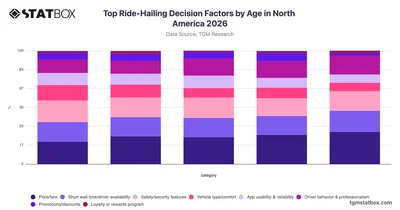
Top Ride-Hailing Decision Factors by Age in North America 2026 Premium

Top Ride-Hailing Decision Factors by Age in North America 2026

Explore how ride-hailing decision factors vary across age groups in North America with TGM StatBox data covering price, safety, wait times, and more.
North America Ride-hailing Published 2026
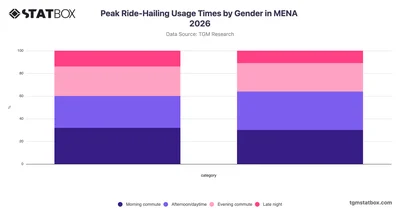
Peak Ride-Hailing Usage Times by Gender in MENA 2026 Premium

Peak Ride-Hailing Usage Times by Gender in MENA 2026

Compare ride-hailing usage times by gender across MENA with TGM StatBox, revealing when men and women most rely on ride-hailing services throughout the day.
MENA Ride-hailing Published 2026
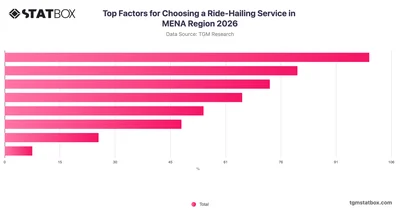
Top Factors for Choosing a Ride-Hailing Service in MENA Region 2026 Premium

Top Factors for Choosing a Ride-Hailing Service in MENA Region 2026

Explore what drives ride-hailing service choices across MENA, from pricing to safety and app reliability, with data from TGM StatBox.
MENA Ride-hailing Published 2026
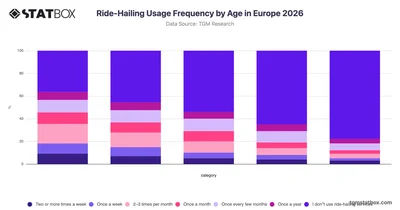
Ride-Hailing Usage Frequency by Age in Europe 2026 Premium

Ride-Hailing Usage Frequency by Age in Europe 2026

Explore how ride-hailing usage frequency varies across age groups in Europe with this TGM StatBox chart covering adults from 18 to 75.
Europe Ride-hailing Published 2026
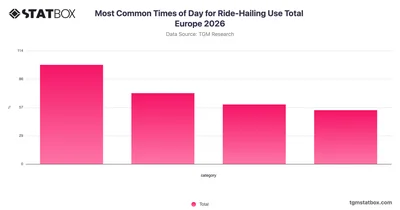
Most Common Times of Day for Ride-Hailing Use Total Europe 2026 Premium

Most Common Times of Day for Ride-Hailing Use Total Europe 2026

Explore how Europeans use ride-hailing services at different times of day with this TGM StatBox chart covering usage patterns across Europe in 2026.
Europe Ride-hailing Published 2026
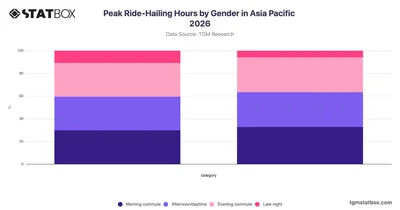
Peak Ride-Hailing Hours by Gender in Asia Pacific 2026 Premium

Peak Ride-Hailing Hours by Gender in Asia Pacific 2026

Compare peak ride-hailing hours by gender across Asia Pacific in 2026 with TGM StatBox, covering morning, daytime, evening, and late-night usage patterns.
Asia Pacific Ride-hailing Published 2026
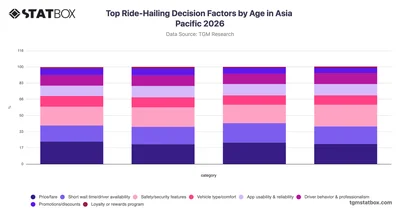
Top Ride-Hailing Decision Factors by Age in Asia Pacific 2026 Premium

Top Ride-Hailing Decision Factors by Age in Asia Pacific 2026

Explore how ride-hailing decision factors vary across age groups in Asia Pacific with TGM StatBox's 2026 breakdown of key consumer priorities.
Asia Pacific Ride-hailing Published 2026
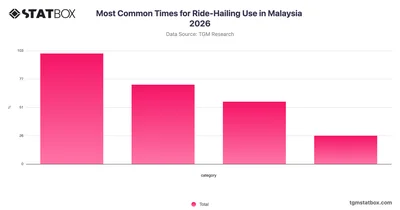
Most Common Times for Ride-Hailing Use in Malaysia 2026 Premium

Most Common Times for Ride-Hailing Use in Malaysia 2026

Explore when Malaysians most commonly use ride-hailing services with TGM StatBox data on peak usage times across different parts of the day in Malaysia 2026.
Malaysia Ride-hailing Published 2026
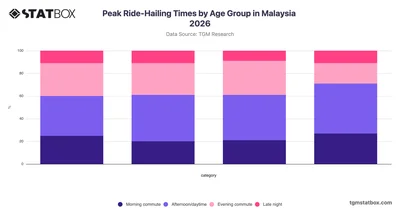
Peak Ride-Hailing Times by Age Group in Malaysia 2026 Premium

Peak Ride-Hailing Times by Age Group in Malaysia 2026

Explore how ride-hailing usage times vary across age groups in Malaysia with this TGM StatBox chart covering morning, afternoon, evening, and late-night patterns.
Malaysia Ride-hailing Published 2026
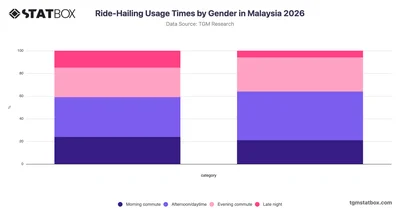
Ride-Hailing Usage Times by Gender in Malaysia 2026 Premium

Ride-Hailing Usage Times by Gender in Malaysia 2026

Compare ride-hailing usage times by gender in Malaysia with TGM StatBox, covering how men and women differ across morning, daytime, evening, and late-night trips.


Malaysia Ride-hailing Published 2026
Showing page 127 of 205 — 6149 charts
1 … 125 126 127 128 129 … 205




