Insights library
Not sure where to start? Dive into a diverse selection of charts and data visualizations across topics, and find the information you need to drive your research and analysis.
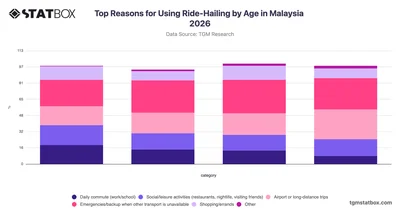

Explore how different age groups in Malaysia use ride-hailing services and their key reasons, with full survey data available on TGM StatBox.
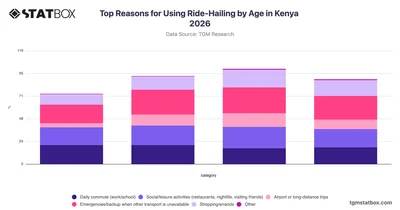
Explore why Kenyans across age groups use ride-hailing services in 2026 with TGM StatBox, covering commuting, leisure, emergencies, and more.
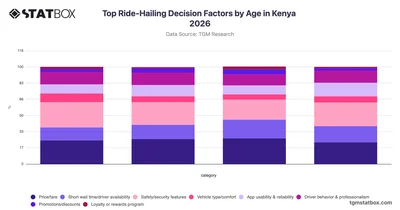
Explore how age shapes ride-hailing decision factors in Kenya with TGM StatBox data covering price, safety, app usability, and more across four age groups.
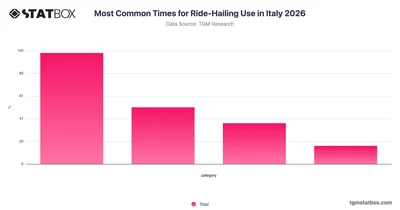
Explore how Italians time their ride-hailing use throughout the day with this TGM StatBox chart covering usage patterns across Italy in 2026.
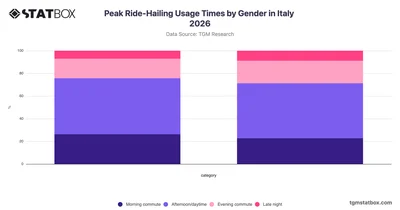
Compare peak ride-hailing usage times by gender in Italy with TGM StatBox, revealing how men and women differ in their preferred hours for booking rides.
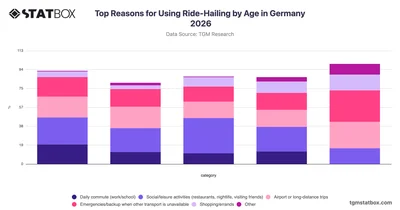
Explore how ride-hailing usage reasons vary across age groups in Germany with this TGM StatBox chart covering commuting, leisure, travel, and more.
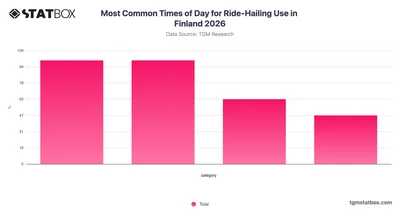
Explore how Finns use ride-hailing services at different times of day in this TGM StatBox chart covering usage patterns across Finland in 2026.
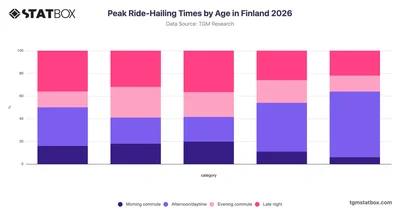
Explore how ride-hailing usage times vary across age groups in Finland with this TGM StatBox chart covering peak travel periods from morning commutes to late night.
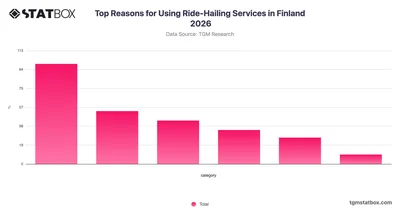
Explore why people in Finland use ride-hailing services in 2026 with TGM StatBox, covering key reasons from daily commutes to social and leisure activities.
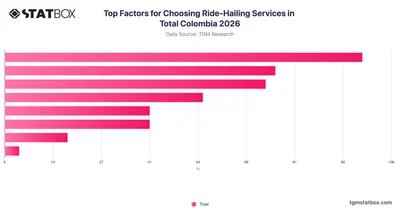
Explore what drives ride-hailing service choices in Colombia with TGM StatBox, covering key factors from pricing and safety to app usability and loyalty programs.
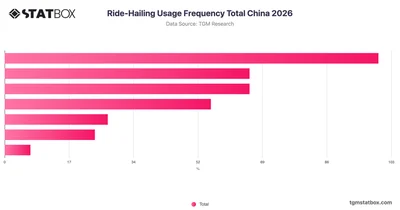
Explore how frequently people in China use ride-hailing services with this TGM StatBox chart covering usage patterns from daily riders to non-users.
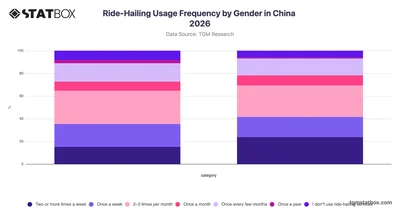
Explore ride-hailing usage frequency by gender in China with TGM StatBox, covering how often men and women use these services across key frequency categories.
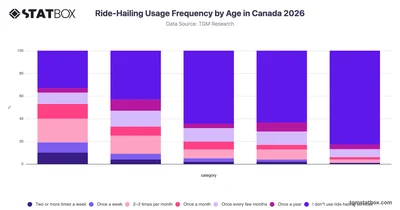
Explore how ride-hailing usage frequency varies across age groups in Canada with TGM StatBox's 2026 data breakdown by generation.
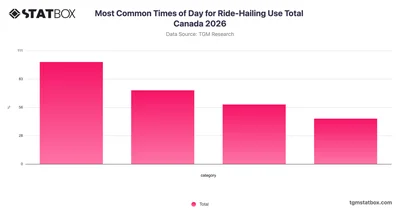
Explore when Canadians use ride-hailing services throughout the day with TGM StatBox data covering morning, daytime, evening, and late-night usage patterns in Canada 2026.
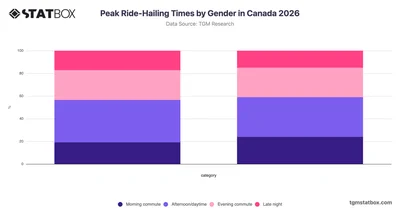
Compare peak ride-hailing times by gender in Canada with TGM StatBox, covering morning, daytime, evening, and late-night usage patterns.
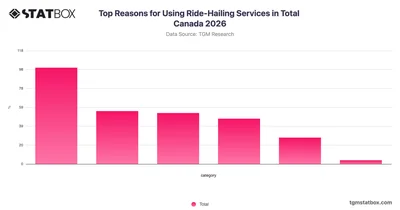
Explore why Canadians choose ride-hailing services in 2026 with TGM StatBox, covering key motivations from daily commutes to social and leisure activities.
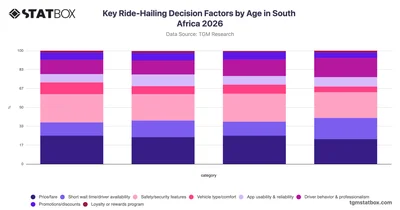
Discover how age shapes ride-hailing decision factors in South Africa with TGM StatBox data covering price, safety, wait time, and more across four age groups.
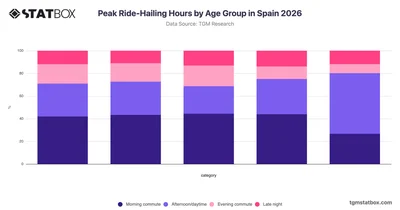
Discover how ride-hailing usage in Spain varies by time of day across age groups with TGM StatBox data on peak hours from 2026.
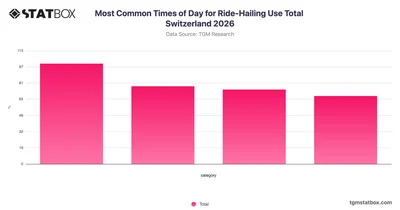
Discover how ride-hailing use is distributed across times of day in Switzerland with this TGM StatBox chart covering morning, daytime, evening, and late-night patterns.
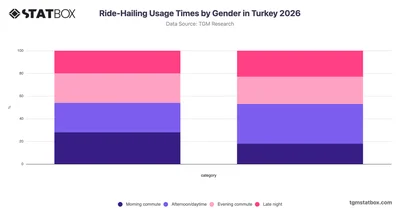
Compare how men and women in Turkey differ in their preferred ride-hailing usage times with gender-segmented data from TGM StatBox.
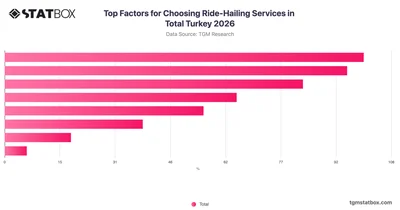
Discover what factors drive ride-hailing service choices in Turkey with this TGM StatBox chart covering price, safety, app usability, and more.
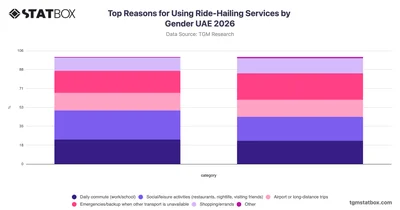
Discover how men and women in the UAE differ in their reasons for using ride-hailing services with gender-segmented data on TGM StatBox.
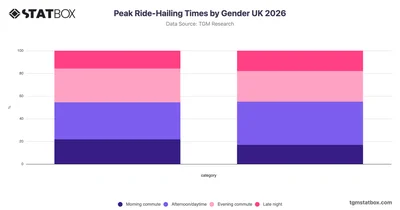
Compare how men and women in the UK differ in their peak ride-hailing usage times with this TGM StatBox chart breaking down preferences by time of day.
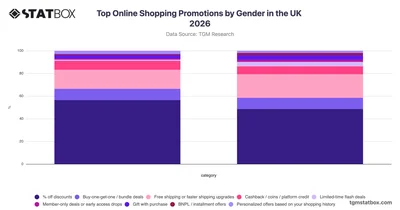
TGM StatBox explores UK online shopping promotions by gender in 2026, where percentage-off discounts dominate for both sexes while free shipping ranks higher among women.
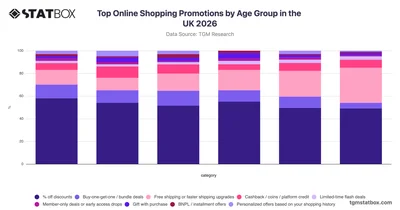
Explore TGM StatBox data on UK online shopping promotions by age group in 2026, where percentage discounts dominate across all ages while free shipping is especially valued by older shoppers.
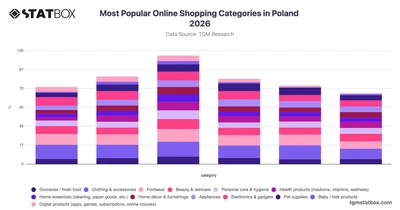
Explore TGM StatBox data on Poland's top online shopping categories in 2026, where clothing dominates across all ages and electronics rank high among younger shoppers.
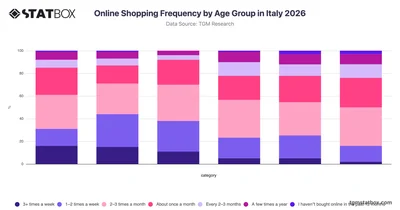
Explore Italy's 2026 online shopping frequency by age on TGM StatBox, where younger adults shop most often weekly while older groups prefer monthly purchases.
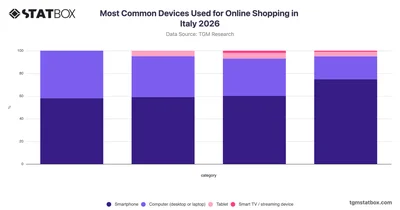
See how online shopping device use varies by shopper type in Italy in 2026, with smartphones leading across groups and computers remaining a secondary choice.
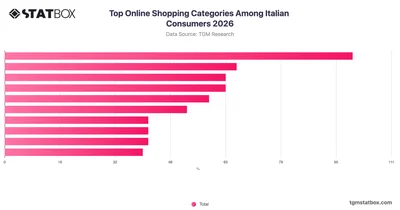
Explore TGM StatBox data on Italy's top online shopping categories in 2026, where clothing dominates and footwear, beauty, and health products rank among the most purchased.
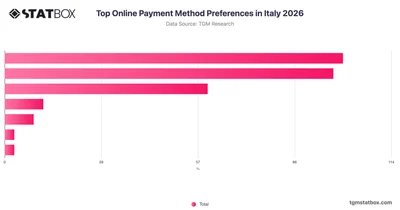
PayPal leads Italian online payment preferences ahead of credit cards, with debit cards and cash alternatives trailing far behind — explore the full breakdown on TGM StatBox.






