Insights library
Not sure where to start? Dive into a diverse selection of charts and data visualizations across topics, and find the information you need to drive your research and analysis.
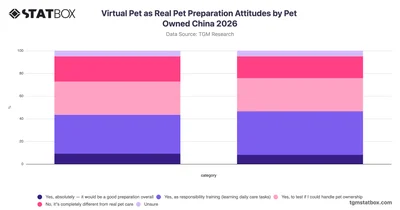

Explore how cat and dog owners in China view virtual pets as preparation for real pet ownership with this TGM StatBox survey data from 2026.
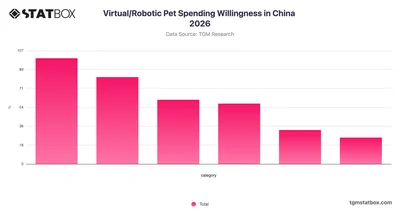
Explore consumer spending willingness on virtual and robotic pets in China with this TGM StatBox chart covering a range of budget preferences for 2026.
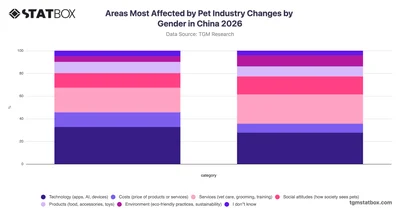
Explore how pet industry changes affect different areas by gender in China with this 2026 TGM StatBox chart covering technology, services, costs, and more.
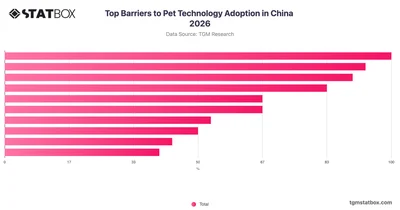
Explore the key barriers holding back pet technology adoption in China with this TGM StatBox chart covering consumer concerns, habits, and attitudes.
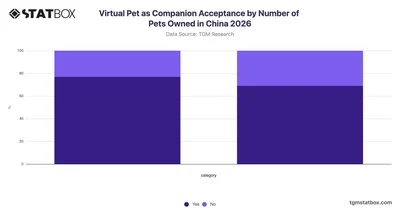
Compare virtual pet companion acceptance across pet ownership groups in China with TGM StatBox data segmented by single and multi-pet owners.
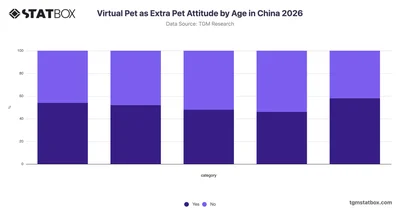
Explore how different age groups in China view virtual pets as extra companions with TGM StatBox's 2026 breakdown of attitudes across generations.
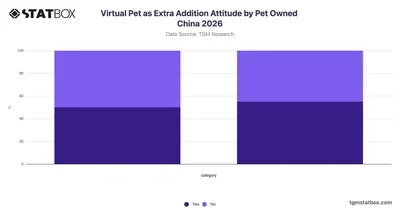
Explore how cat and dog owners in China feel about adding a virtual pet, with survey data from TGM StatBox breaking down attitudes by pet type.
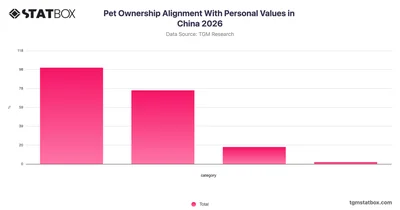
Explore how pet ownership aligns with personal values in China with TGM StatBox, offering clear insights into consumer attitudes and lifestyle priorities.
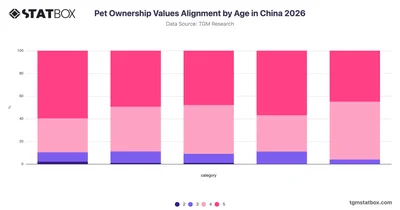
Explore how pet ownership values alignment varies across age groups in China with 2026 data from TGM StatBox, covering adults from 18 to 55+.
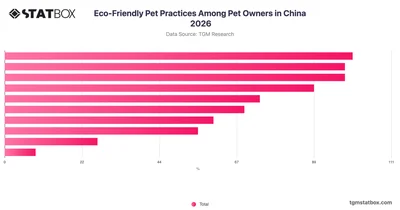
Explore eco-friendly pet practices among pet owners in China with TGM StatBox, covering sustainable choices from waste management to product selection.
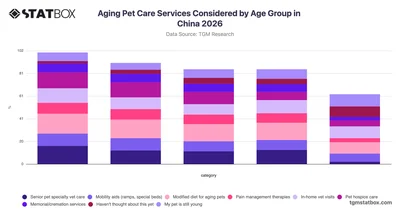
Explore how different age groups in China consider aging pet care services in 2026 with this TGM StatBox chart covering senior vet care, mobility aids, and more.
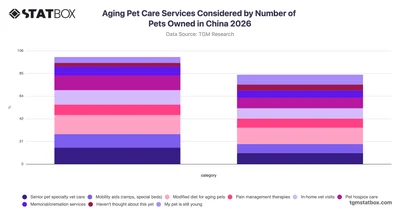
Compare aging pet care services considered by single and multi-pet owners in China with this TGM StatBox chart covering vet care, mobility aids, diet, and more.
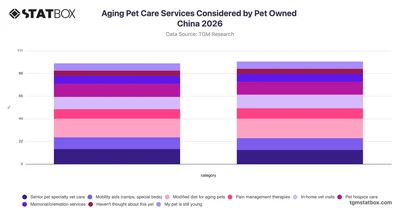
Explore aging pet care services considered by cat and dog owners in China with this 2026 TGM StatBox chart covering options from modified diets to hospice care.
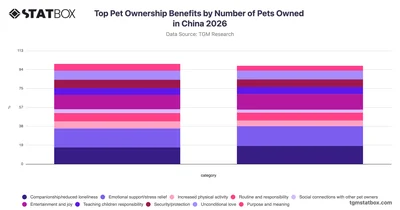
Compare pet ownership benefits reported by single and multi-pet owners in China with TGM StatBox data covering emotional, social, and lifestyle factors.
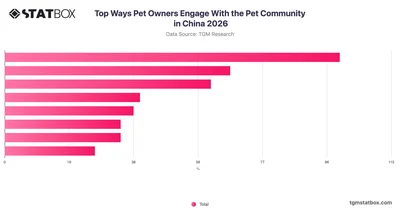
Explore how pet owners in China engage with the pet community, from social media to events and charities, with data from TGM StatBox.
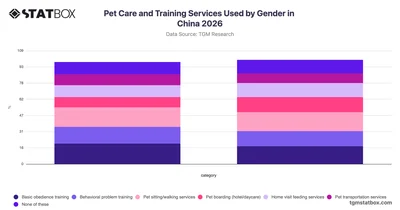
Compare pet care and training service usage by gender in China with 2026 data from TGM StatBox, covering boarding, sitting, training, and more.
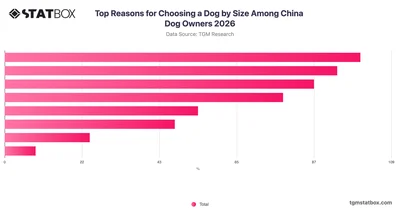
Explore why China dog owners choose a specific dog size, from breed traits to lifestyle fit, with survey data from TGM StatBox.
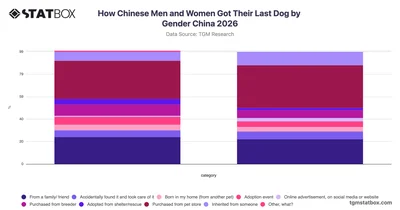
Explore how Chinese men and women acquired their most recent dog in China with gender-based data from TGM StatBox's 2026 survey.
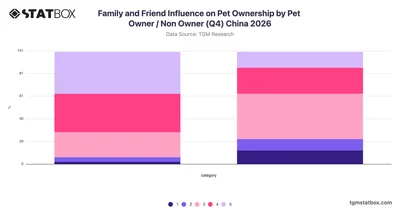
Explore how family and friend influence on pet ownership differs between pet owners and non-owners in China with TGM StatBox 2026 survey data.
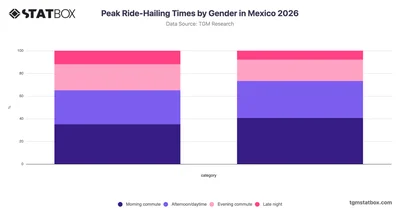
Compare peak ride-hailing times by gender in Mexico with TGM StatBox, revealing how men and women differ in their preferred hours for using ride-hailing services.
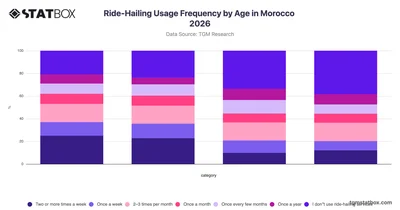
Explore how often different age groups in Morocco use ride-hailing services in 2026 with this TGM StatBox chart covering weekly to yearly usage frequencies.
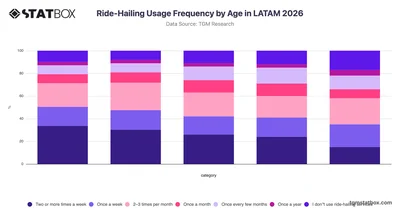
Explore ride-hailing usage frequency across age groups in LATAM with TGM StatBox, covering how often different generations use these services in 2026.
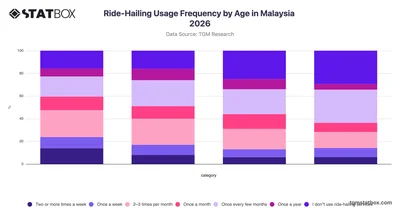
Explore ride-hailing usage frequency across age groups in Malaysia with TGM StatBox, comparing how often different generations use these services in 2026.
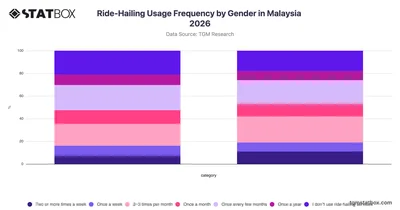
Explore how often Malaysian men and women use ride-hailing services in 2026 with gender-based frequency data from TGM StatBox.
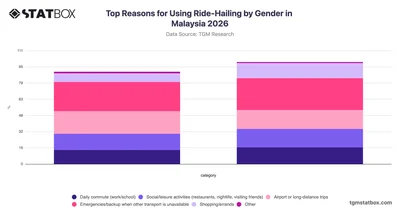
Explore how men and women in Malaysia differ in their reasons for using ride-hailing services with gender-segmented data from TGM StatBox.
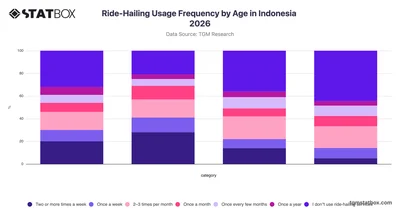
Explore how often different age groups in Indonesia use ride-hailing services in 2026 with this TGM StatBox chart covering weekly to yearly usage frequencies.
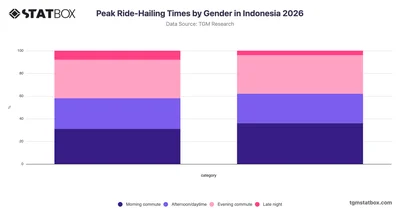
Compare ride-hailing peak usage times by gender in Indonesia with TGM StatBox data covering morning, daytime, evening, and late-night travel patterns.
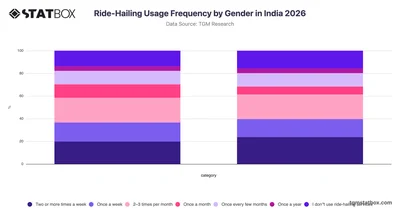
Explore how often men and women in India use ride-hailing services in 2026 with gender-segmented frequency data from TGM StatBox.
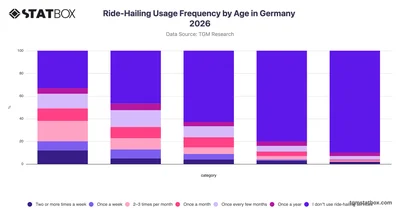
Explore how ride-hailing usage frequency varies across age groups in Germany with this TGM StatBox chart covering adults from 18 to 75.
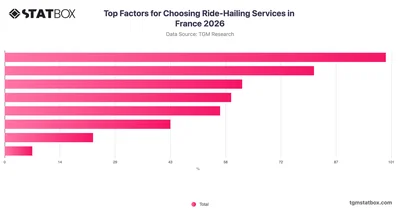
Explore what drives ride-hailing service choices in France with TGM StatBox data covering price, safety, app usability, driver behavior, and more.






