Insights library
Not sure where to start? Dive into a diverse selection of charts and data visualizations across topics, and find the information you need to drive your research and analysis.
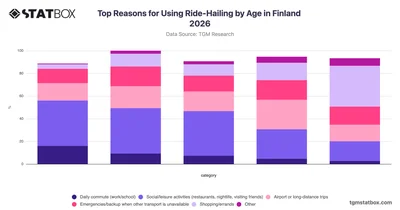

Explore how ride-hailing usage reasons vary across age groups in Finland with this TGM StatBox chart covering commuting, leisure, shopping, and more.
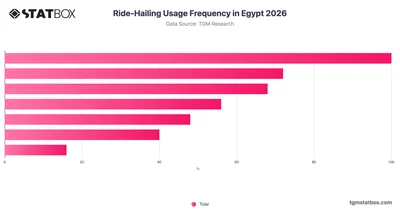
Explore ride-hailing usage frequency in Egypt with TGM StatBox, covering how often Egyptians use these services in 2026.
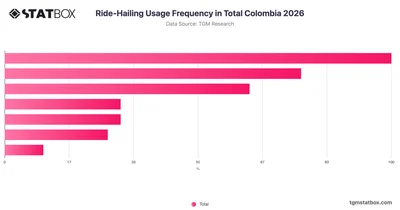
Explore ride-hailing usage frequency in Colombia with TGM StatBox, covering how often Colombians use these services throughout 2026.
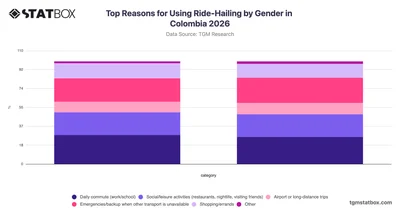
Explore why Colombians use ride-hailing services, broken down by gender, with this TGM StatBox chart covering key usage motivations in Colombia 2026.
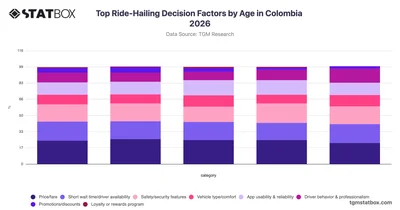
Explore how ride-hailing decision factors vary across age groups in Colombia with this TGM StatBox chart covering price, safety, app usability, and more.
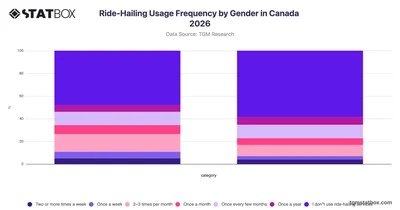
Explore ride-hailing usage frequency by gender in Canada with TGM StatBox, covering how often men and women use these services in 2026.
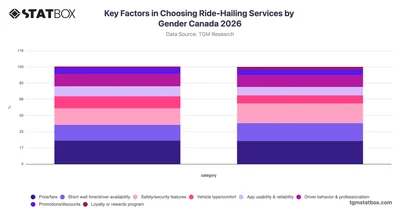
Compare how male and female Canadians prioritize factors when choosing ride-hailing services in this TGM StatBox chart covering Canada 2026.
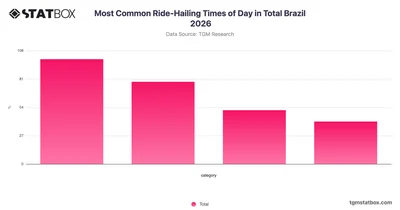
Explore how Brazilians use ride-hailing services throughout the day with TGM StatBox's 2026 breakdown of peak usage times across Brazil.
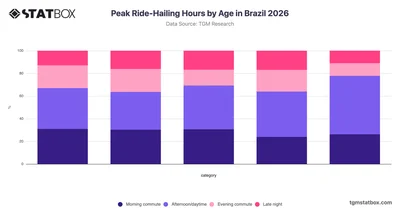
Explore how ride-hailing usage in Brazil varies by time of day across age groups with TGM StatBox's 2026 breakdown of peak hours and travel patterns.
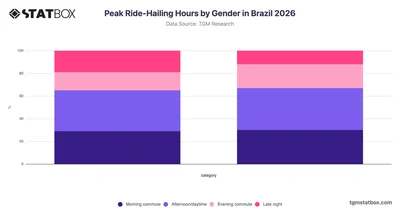
Compare ride-hailing usage patterns by gender in Brazil with TGM StatBox data on peak hours across morning, daytime, evening, and late-night periods.
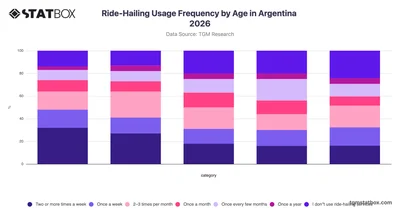
Explore how often different age groups in Argentina use ride-hailing services in 2026 with this TGM StatBox chart breaking down usage frequency by generation.
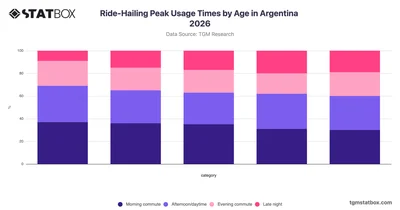
Explore how ride-hailing peak usage times vary across age groups in Argentina with TGM StatBox's 2026 breakdown of morning, daytime, evening, and late-night patterns.
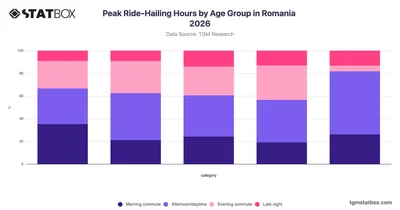
Compare ride-hailing usage patterns across age groups in Romania with TGM StatBox data on peak hours from morning commutes to late night travel in 2026.
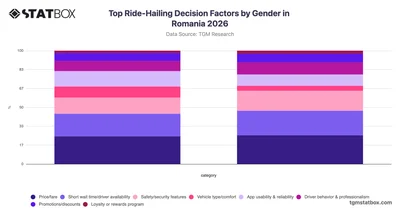
Compare how male and female riders in Romania prioritize ride-hailing decisions across key factors like price, safety, and app usability with TGM StatBox.
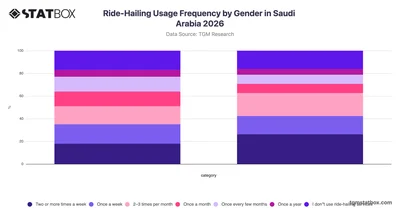
Discover how ride-hailing usage frequency differs by gender in Saudi Arabia with this TGM StatBox chart covering usage patterns from regular riders to non-users.
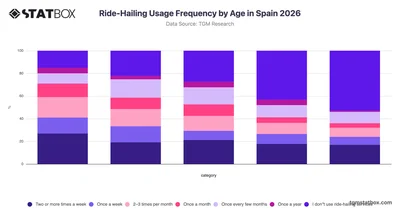
Discover how ride-hailing usage frequency varies across age groups in Spain with this TGM StatBox chart covering adults from 18 to 75.
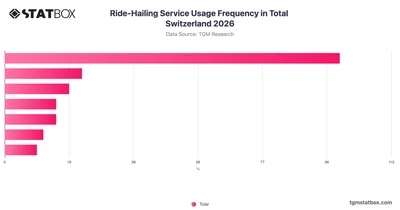
Discover how frequently people in Switzerland use ride-hailing services in 2026 with clear survey data from TGM StatBox.
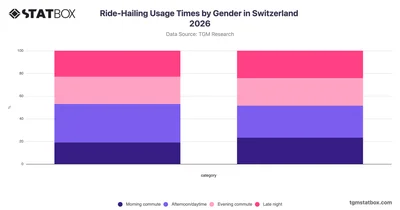
Compare ride-hailing usage times by gender in Switzerland with this TGM StatBox chart covering morning, daytime, evening, and late-night travel patterns.
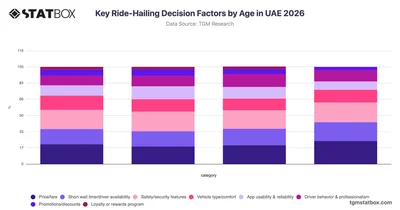
Discover how age shapes ride-hailing decision factors among UAE consumers in 2026 with this TGM StatBox breakdown of key priorities across four age groups.
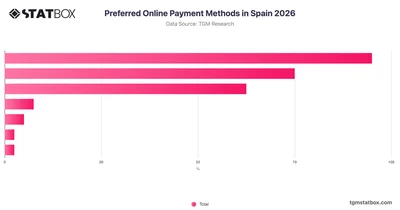
Debit cards lead online payments in Spain, followed closely by credit cards and PayPal — explore the full 2026 breakdown on TGM StatBox.
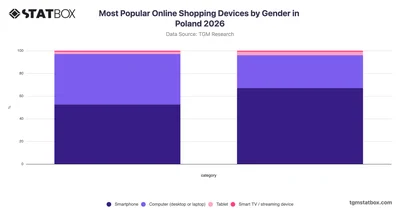
Explore TGM StatBox data on online shopping devices by gender in Poland, where women favour smartphones and men show stronger preference for computers.
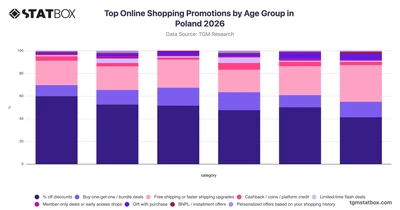
Explore TGM StatBox data on Poland's top online shopping promotions by age group in 2026, where percentage discounts dominate across all ages and older shoppers favor free shipping.
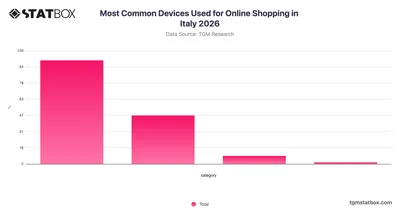
Smartphones dominate online shopping device usage in Italy, far ahead of computers and tablets, according to TGM StatBox data for 2026.
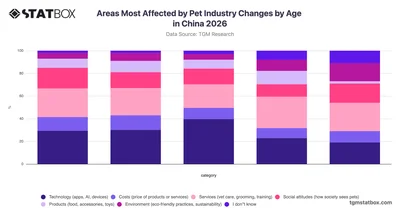
Explore how different age groups in China perceive the areas most affected by pet industry changes in 2026, with full data available on TGM StatBox.
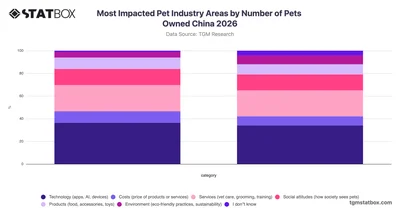
Explore how different pet industry areas are impacted by pet ownership in China with TGM StatBox data comparing single and multi-pet owners.
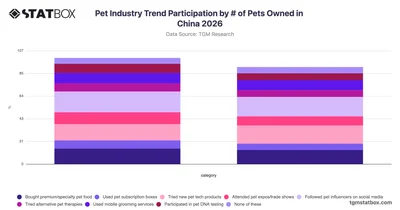
Compare pet industry trend participation among single and multi-pet owners in China with TGM StatBox's 2026 breakdown of behaviors and engagement patterns.
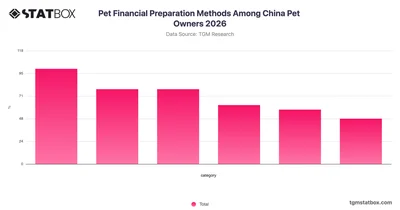
Explore how pet owners in China financially prepare for pet-related costs with survey data from TGM StatBox covering methods from insurance to budgeting.
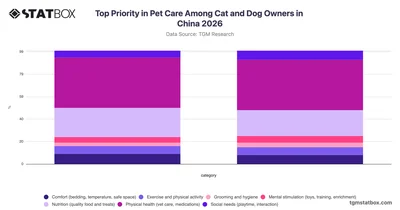
Explore how cat and dog owners in China prioritize different aspects of pet care in 2026 with data from TGM StatBox.
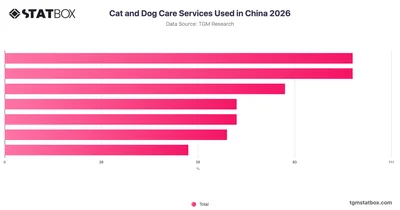
Explore cat and dog care services used in China with this TGM StatBox chart covering training, boarding, pet sitting, and more service categories.
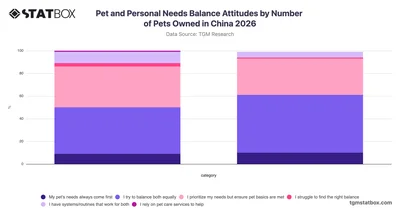
Explore how pet owners in China balance personal and pet needs across single and multi-pet households with TGM StatBox's 2026 survey data.






