Insights library
Not sure where to start? Dive into a diverse selection of charts and data visualizations across topics, and find the information you need to drive your research and analysis.
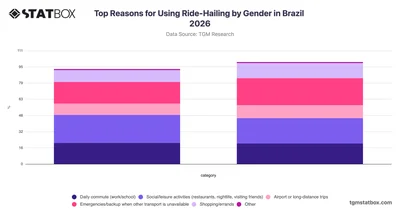

Explore why Brazilians use ride-hailing services, with gender-based breakdowns across key use cases, in this TGM StatBox chart for Brazil 2026.
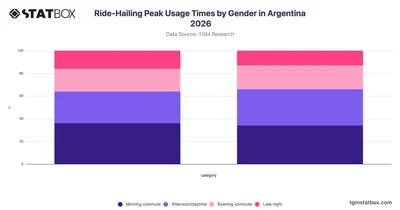
Compare ride-hailing peak usage times by gender in Argentina with TGM StatBox, covering morning, daytime, evening, and late-night travel patterns.
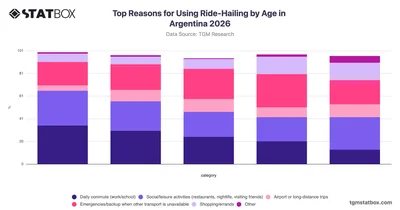
Explore how ride-hailing usage reasons vary across age groups in Argentina with this TGM StatBox chart covering commuting, leisure, emergencies, and more.
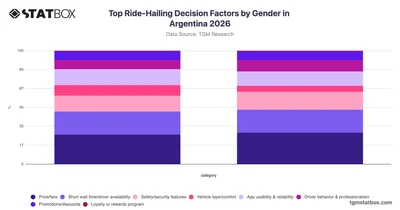
Compare how male and female riders in Argentina prioritize ride-hailing decisions with gender-segmented data from TGM StatBox.
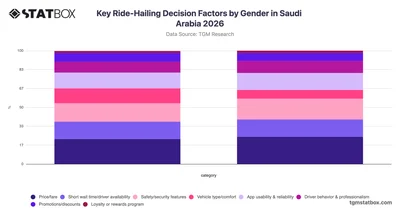
Discover how gender shapes ride-hailing decision factors in Saudi Arabia with TGM StatBox data covering price, safety, comfort, and more.
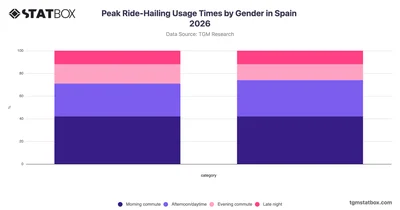
Compare ride-hailing peak usage times by gender in Spain with TGM StatBox, covering morning, daytime, evening, and late-night patterns.
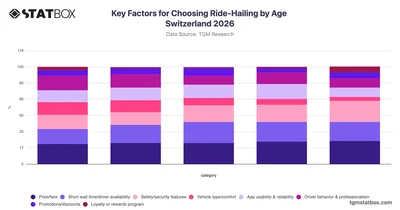
Discover how ride-hailing choice factors vary across age groups in Switzerland with this TGM StatBox chart covering price, safety, app usability, and more.
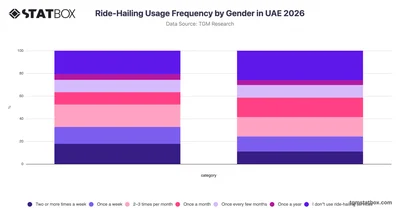
Compare ride-hailing usage frequency by gender in the UAE with TGM StatBox, covering how often men and women use these services.
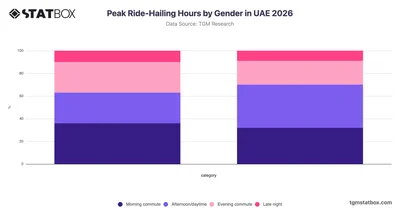
Compare peak ride-hailing hours by gender in the UAE with TGM StatBox, exploring how morning, daytime, evening, and late-night usage patterns differ between men and women.
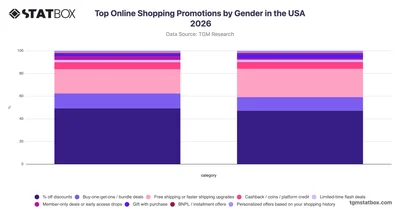
Explore TGM StatBox data on top online shopping promotions by gender in the USA, where percentage-off discounts lead for both sexes and free shipping ranks highest among women.
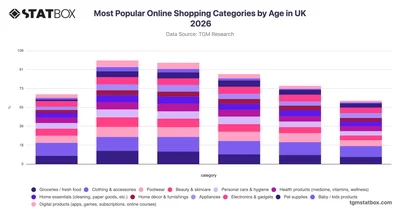
Explore TGM StatBox data on UK online shopping habits by age in 2026, where clothing dominates across all groups and groceries surge among 25–44-year-olds.
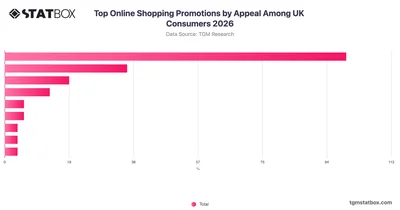
Explore TGM StatBox data on UK consumers' favourite online shopping promotions, where percentage-off discounts dominate and free shipping ranks as a strong second.
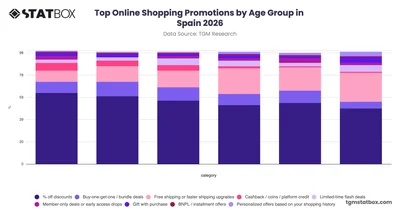
Explore TGM StatBox data on Spain's top online shopping categories by age in 2026, where clothing dominates across all groups and groceries peak among middle-aged shoppers.
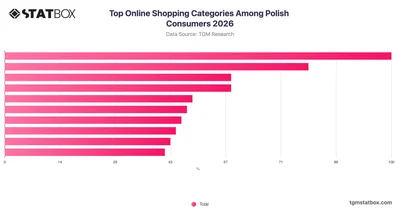
Clothing & accessories and footwear dominate online shopping in Poland, per TGM StatBox data on the top e-commerce categories among Polish consumers in 2026.
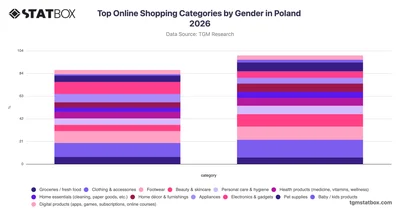
Explore TGM StatBox data on Poland's top online shopping categories by gender in 2026, where women lead in clothing and beauty while men dominate electronics.
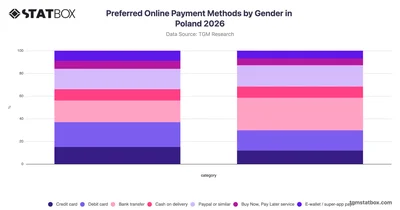
Explore TGM StatBox data on preferred online payment methods by gender in Poland 2026, where bank transfers dominate among women while debit cards lead for men.
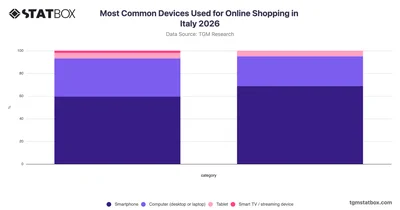
Explore the most used devices for online shopping in Italy by gender in 2026, including differences in smartphone usage between men and women on TGM StatBox.
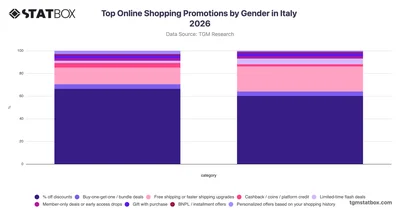
Explore TGM StatBox data on Italy's top online shopping promotions by gender in 2026, where discounts dominate for both, but women favor free shipping more than men.
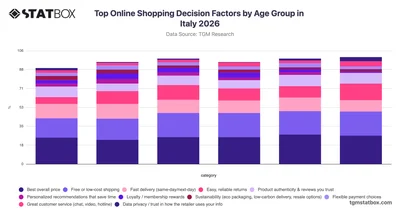
Explore TGM StatBox data on what drives online purchases in Italy, where price dominates across all age groups and older shoppers prioritize free shipping and easy returns.
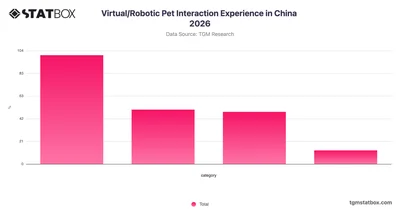
Explore how Chinese consumers engage with virtual and robotic pets in China with this 2026 TGM StatBox chart covering ownership, trial, and interest levels.
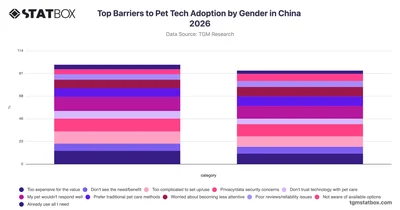
Compare gender differences in barriers to pet tech adoption in China with this TGM StatBox chart covering cost, complexity, privacy, and trust concerns.
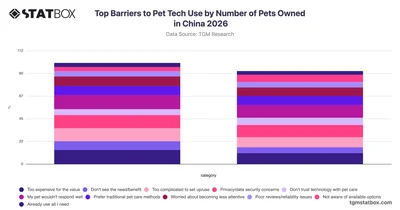
Compare barriers to pet tech adoption among single and multi-pet owners in China with this TGM StatBox chart covering cost, complexity, privacy, and trust concerns.
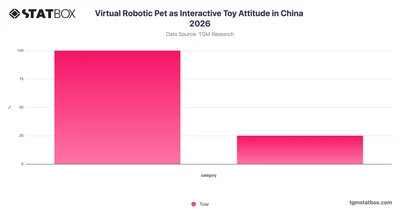
Explore how Chinese consumers feel about virtual robotic pets as interactive toys with this TGM StatBox chart covering attitudes in China for 2026.
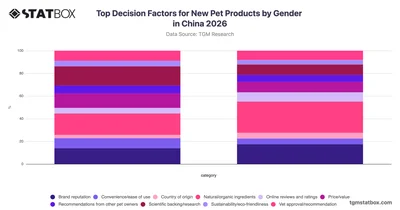
Compare how male and female pet owners in China weigh key factors when choosing new pet products, with gender-based data from TGM StatBox.
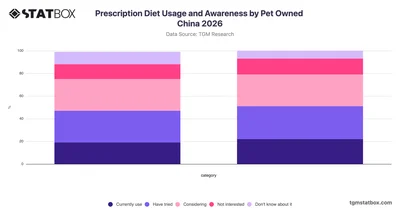
Explore prescription diet usage and awareness among cat and dog owners in China with this 2026 TGM StatBox chart covering current use, trial, and consideration rates.
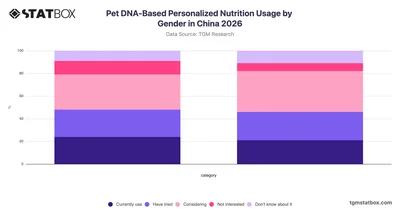
Explore how male and female pet owners in China engage with DNA-based personalized nutrition for pets, with gender breakdowns available on TGM StatBox.
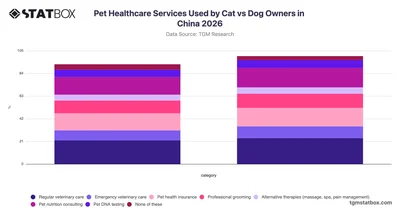
Compare pet healthcare service usage among cat and dog owners in China with this TGM StatBox chart covering veterinary care, insurance, grooming, and more.
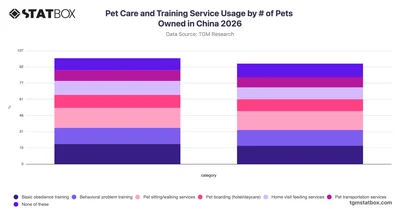
Explore pet care and training service usage among single and multi-pet owners in China with this 2026 TGM StatBox chart covering key services and preferences.
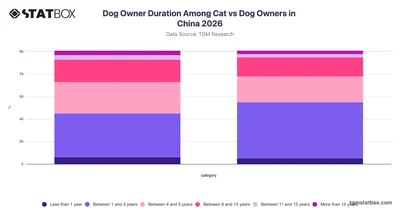
Compare how long cat and dog owners in China have kept their pets with this TGM StatBox chart on dog owner duration across both groups in 2026.
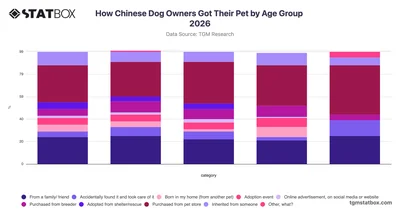
Explore how Chinese dog owners across age groups acquired their pets in China with this TGM StatBox chart breaking down acquisition methods for 2026.






