Insights library
Not sure where to start? Dive into a diverse selection of charts and data visualizations across topics, and find the information you need to drive your research and analysis.
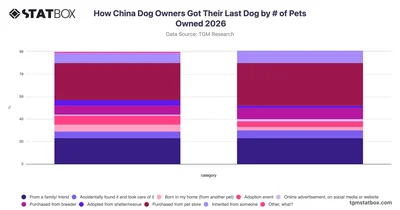

Explore how China dog owners acquired their most recent pet, broken down by single and multi-pet ownership, in this TGM StatBox chart for 2026.
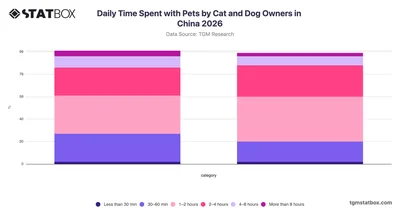
Explore how cat and dog owners in China distribute their daily time with pets in 2026, with full survey data available on TGM StatBox.
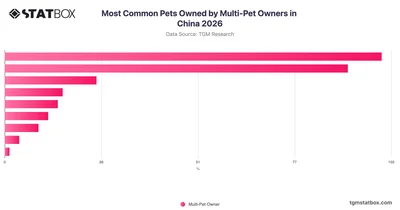
Explore the most common pets owned by multi-pet owners in China with TGM StatBox, covering popular choices from dogs and cats to fish and parrots.
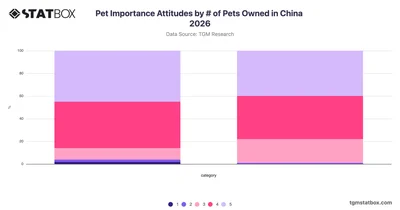
Compare pet importance attitudes among single and multi-pet owners in China with 2026 data from TGM StatBox, segmented by number of pets owned.
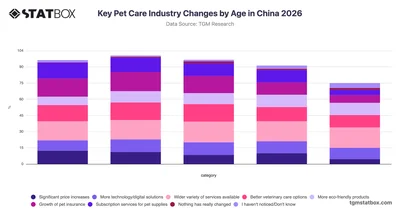
Explore how pet owners across age groups in China perceive key industry changes, from insurance to services, with TGM StatBox data.
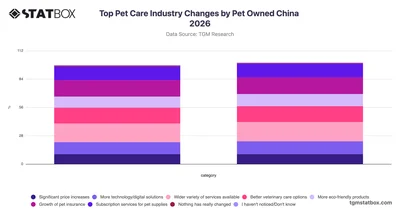
Explore how China's pet care industry is changing in 2026 across cat and dog owners with this TGM StatBox breakdown of services, technology, and more.
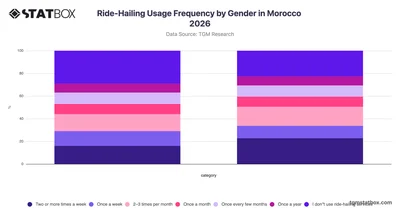
Explore how often men and women in Morocco use ride-hailing services in 2026 with gender-segmented data from TGM StatBox.
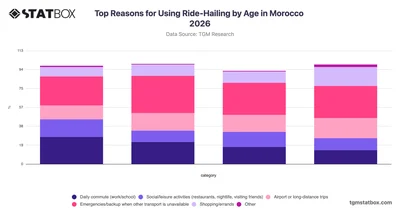
Explore why Moroccans across age groups use ride-hailing services in 2026 with this TGM StatBox chart covering key reasons from commuting to emergencies.
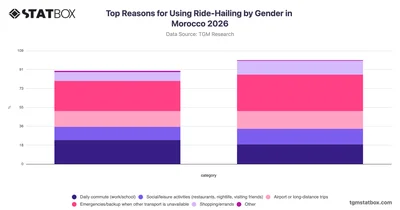
Explore why Moroccan men and women use ride-hailing services differently with gender-segmented data from TGM StatBox covering Morocco in 2026.
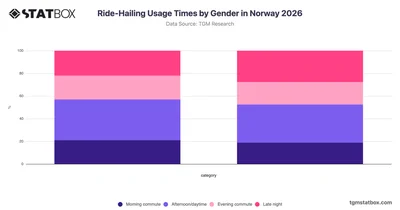
Compare ride-hailing usage times by gender in Norway with TGM StatBox, covering morning, daytime, evening, and late-night travel patterns.
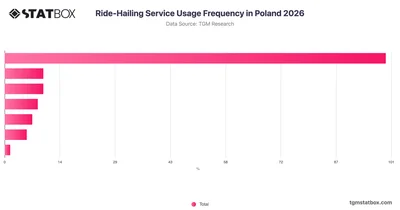
Explore ride-hailing service usage frequency in Poland with TGM StatBox, covering how often Polish respondents use these services in 2026.
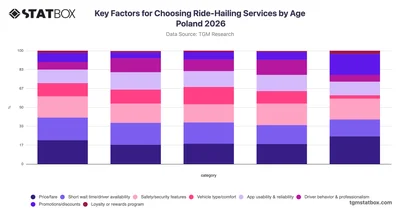
Explore how age shapes ride-hailing service priorities in Poland with TGM StatBox data covering price, safety, wait times, and more across five age groups.
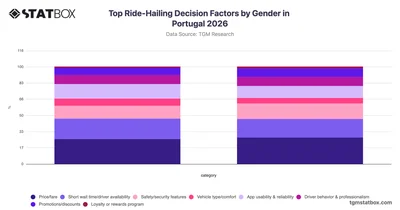
Compare how male and female riders in Portugal prioritize ride-hailing decisions across key factors like price, safety, and app usability with TGM StatBox.
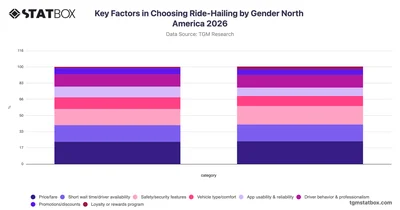
Explore how male and female riders in North America prioritize factors when choosing ride-hailing services, with TGM StatBox gender-breakdown data for 2026.
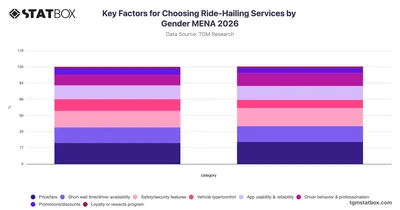
Explore how male and female consumers in MENA prioritize different factors when choosing ride-hailing services with gender-segmented data on TGM StatBox.
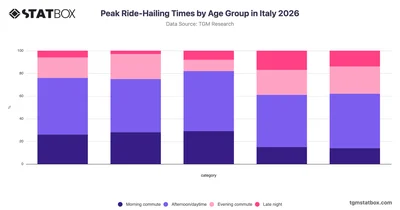
Explore how ride-hailing usage in Italy varies by time of day across age groups with TGM StatBox data on peak travel patterns in 2026.
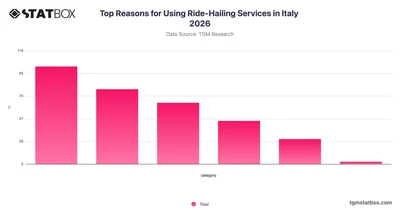
Explore why Italians choose ride-hailing services in 2026, from daily commutes to leisure trips, with clear survey data from TGM StatBox.
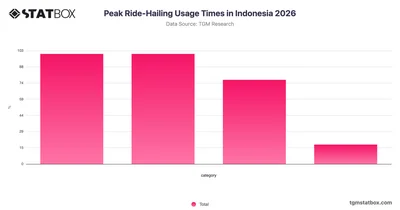
Explore peak ride-hailing usage times in Indonesia with TGM StatBox, revealing when people rely most on ride-hailing services throughout the day in 2026.
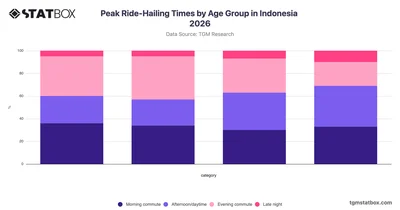
Explore how ride-hailing usage peaks at different times of day across age groups in Indonesia with this TGM StatBox chart on 2026 commuter patterns.
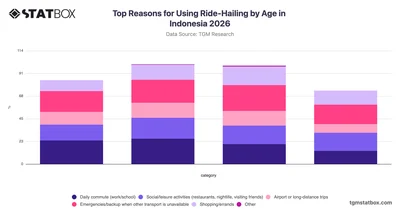
Explore why different age groups in Indonesia use ride-hailing services with TGM StatBox data covering commuting, leisure, emergencies, and more.
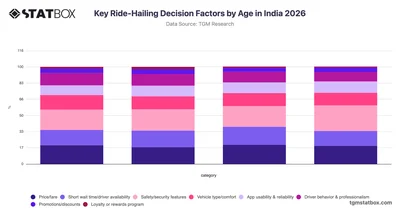
Explore how age shapes ride-hailing decision factors in India with TGM StatBox data covering price, safety, wait times, and more across four age groups.
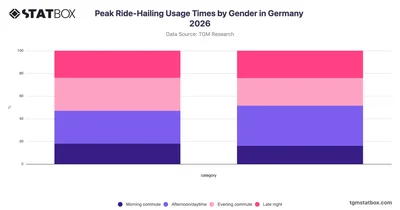
Compare ride-hailing usage times by gender in Germany with this TGM StatBox chart showing when men and women are most likely to use these services.
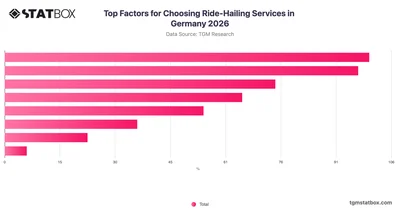
Explore what drives ride-hailing service choices in Germany with TGM StatBox data covering price, safety, app usability, and more key factors.
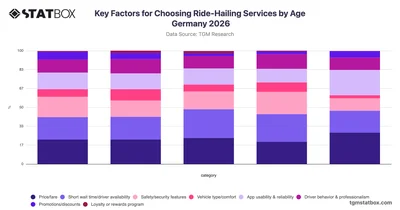
Compare how age shapes ride-hailing service priorities in Germany with TGM StatBox data on price, wait times, safety, and app usability across five age groups.
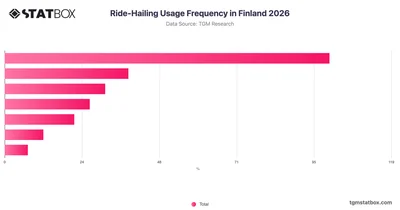
Explore ride-hailing usage frequency in Finland with TGM StatBox, covering how often people use these services across a range of usage patterns in 2026.
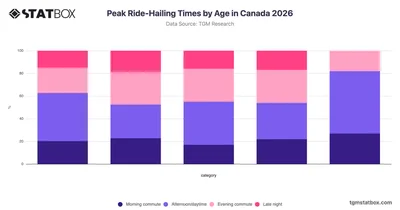
Explore how ride-hailing usage in Canada varies by time of day across age groups with TGM StatBox data on peak travel patterns in 2026.
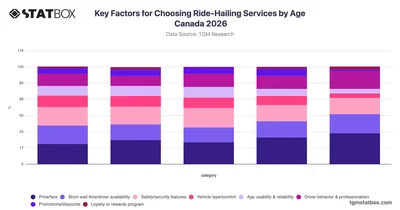
Explore how age shapes ride-hailing service priorities in Canada with TGM StatBox data covering price, safety, wait times, and more across five age groups.
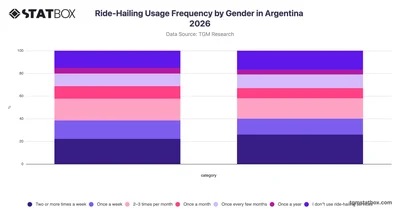
Explore ride-hailing usage frequency by gender in Argentina with TGM StatBox, covering how often males and females use these services in 2026.
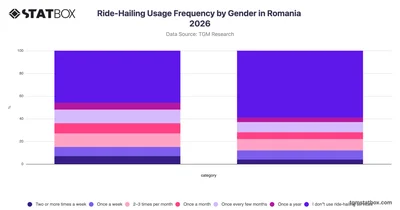
Compare ride-hailing usage frequency by gender in Romania with TGM StatBox, covering how often men and women use these services in 2026.
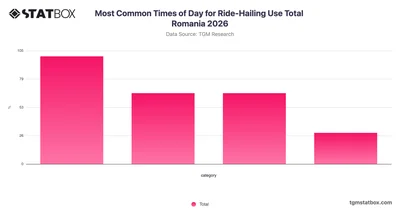
Understand how ride-hailing usage is distributed across different times of day in Romania with this TGM StatBox chart covering 2026 data.






