Insights library
Not sure where to start? Dive into a diverse selection of charts and data visualizations across topics, and find the information you need to drive your research and analysis.
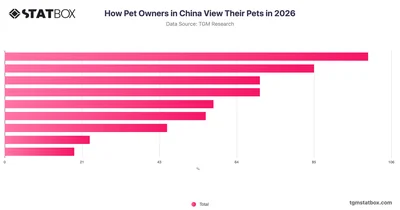

Explore how pet owners in China perceive their pets in 2026, from companionship to emotional support, with data from TGM StatBox.
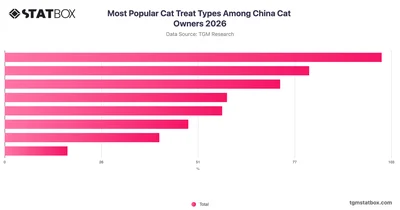
Explore how China cat owners prefer different treat types in 2026 with clear survey data from TGM StatBox covering crunchy, soft, functional, and more.
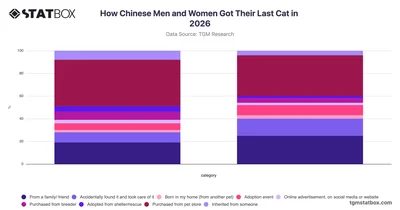
Explore how Chinese men and women acquired their most recent cat in 2026 with gender-based data from China, available on TGM StatBox.
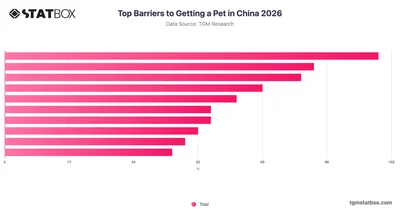
Explore the key barriers preventing people in China from getting a pet, based on survey data from TGM StatBox covering responsibility, space, and more.
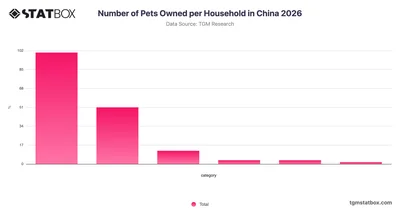
Explore how many pets households in China own with TGM StatBox's 2026 data on pet ownership distribution across Chinese homes.
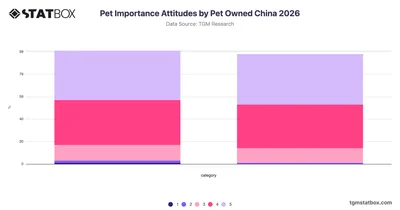
Explore how cat and dog owners in China rate the importance of pets with this TGM StatBox breakdown of pet importance attitudes for 2026.
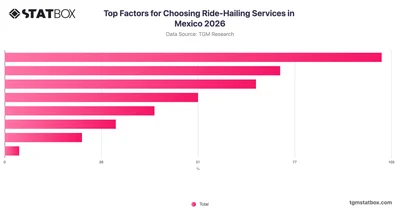
Explore what drives ride-hailing service choices in Mexico with this TGM StatBox chart covering key factors like price, safety, and app reliability.
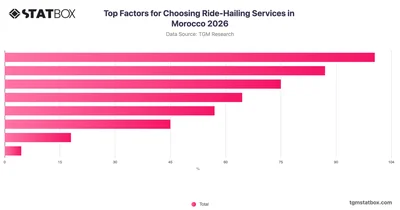
Explore what drives ride-hailing service choices in Morocco with this TGM StatBox chart covering key factors from pricing to app reliability and driver professionalism.
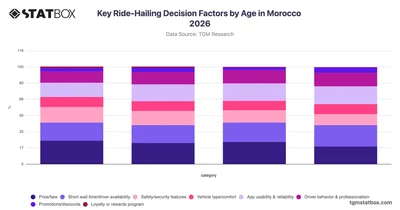
Explore how age shapes ride-hailing decision factors in Morocco with this TGM StatBox chart covering price, safety, app usability, and more.
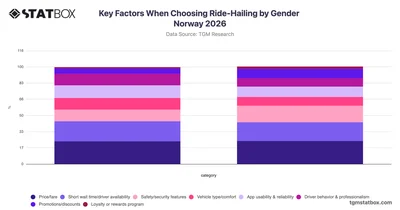
Compare how male and female riders in Norway prioritize ride-hailing factors like price, safety, and app reliability with gender-split data on TGM StatBox.
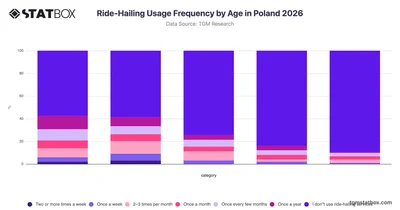
Explore how often different age groups in Poland use ride-hailing services with this TGM StatBox breakdown of usage frequency across generations.
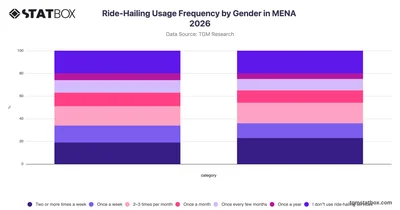
Explore ride-hailing usage frequency by gender across MENA in 2026 with TGM StatBox, revealing how often men and women use these services.
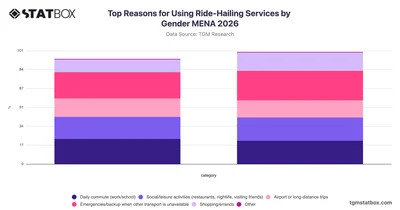
Compare why men and women use ride-hailing services across MENA by purpose, from commuting to emergencies, with gender-split data on TGM StatBox.
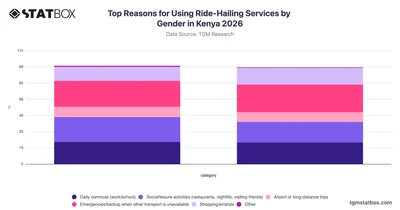
Explore why Kenyans use ride-hailing services, with gender breakdowns across commuting, leisure, emergencies, and more, in this TGM StatBox chart for Kenya 2026.
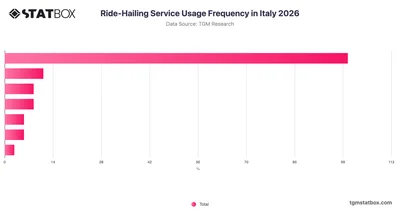
Explore how frequently Italians use ride-hailing services in 2026 with TGM StatBox, covering usage patterns from regular riders to non-users across Italy.
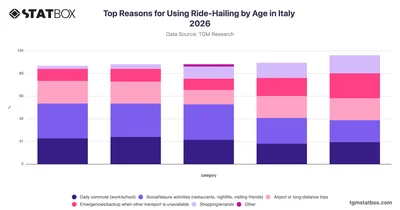
Explore why Italians across age groups use ride-hailing services in Italy with TGM StatBox's 2026 breakdown of motivations by generation.
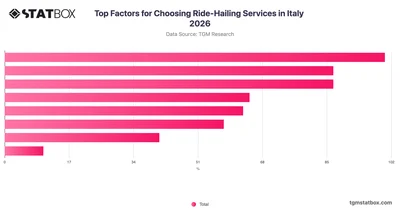
Explore what drives ride-hailing service choices in Italy with TGM StatBox data covering price, safety, wait times, and more key factors.
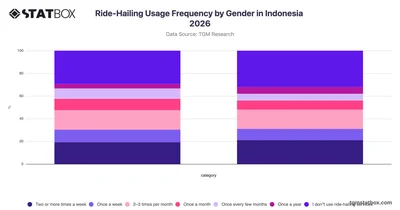
Explore ride-hailing usage frequency by gender in Indonesia with TGM StatBox, covering how often men and women use these services in 2026.
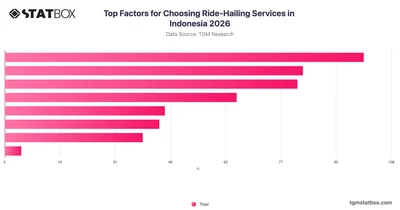
Explore what drives ride-hailing service choices in Indonesia with key consumer preference data, available on TGM StatBox.
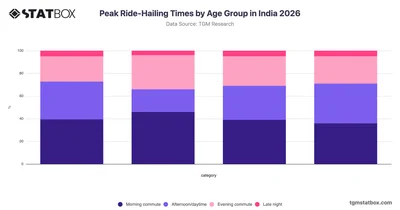
Explore how ride-hailing usage times vary across age groups in India with this TGM StatBox chart covering morning, afternoon, evening, and late-night patterns.
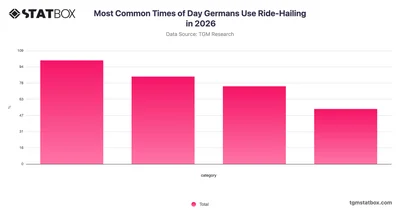
Explore how ride-hailing usage is distributed across different times of day in Germany with this TGM StatBox chart covering 2026 survey data.
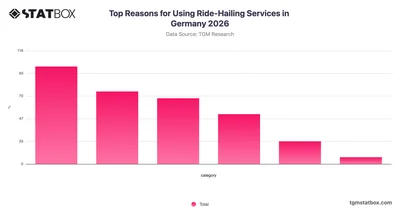
Explore why people in Germany use ride-hailing services, from commuting to leisure, with TGM StatBox data covering key usage motivations in 2026.
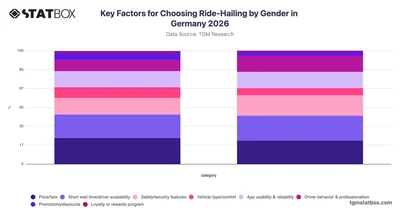
Compare how men and women in Germany prioritize ride-hailing factors in 2026 with gender-segmented data from TGM StatBox.
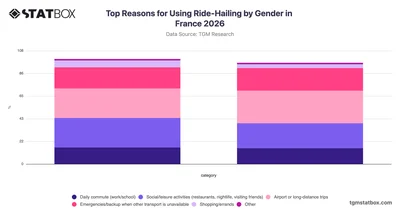
Explore why people use ride-hailing services in France, broken down by gender, with TGM StatBox data covering commuting, leisure, travel, and more.
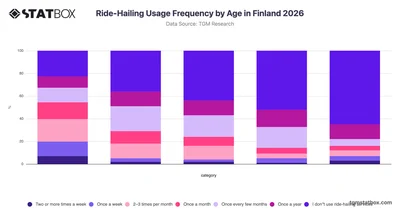
Explore how often different age groups in Finland use ride-hailing services with this TGM StatBox breakdown of usage frequency across generations in 2026.
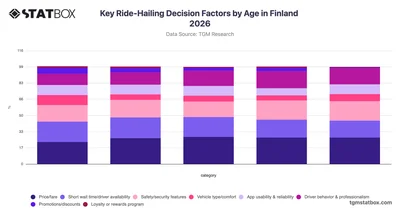
Explore how age shapes ride-hailing decision factors in Finland with TGM StatBox data covering price, safety, wait times, and more across five age groups.
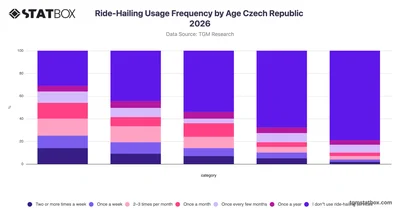
Explore how ride-hailing usage frequency varies across age groups in the Czech Republic with this TGM StatBox chart covering 2026 survey data.
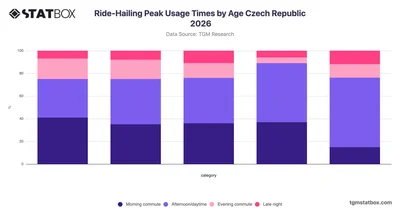
Explore how ride-hailing peak usage times vary across age groups in the Czech Republic with this TGM StatBox chart covering 2026 survey data.
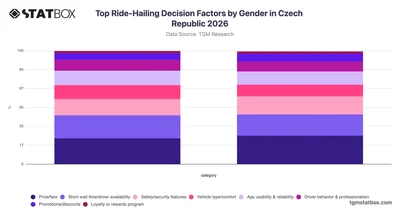
Compare ride-hailing decision factors by gender in Czech Republic with TGM StatBox, covering price, safety, app usability, and more.
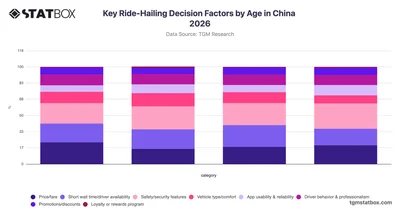
Compare ride-hailing decision factors across age groups in China with TGM StatBox, covering price, safety, wait times, and app usability preferences.






