Insights library
Not sure where to start? Dive into a diverse selection of charts and data visualizations across topics, and find the information you need to drive your research and analysis.
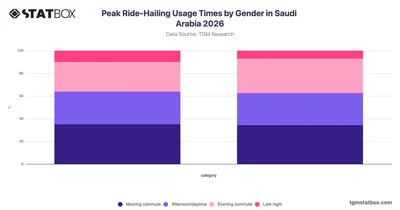

Compare ride-hailing peak usage times by gender in Saudi Arabia with 2026 data from TGM StatBox, covering morning, daytime, evening, and late-night patterns.
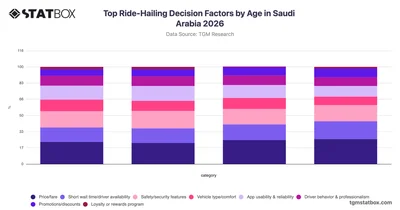
Discover how ride-hailing decision factors vary across age groups in Saudi Arabia with TGM StatBox data covering price, safety, wait times, and more.
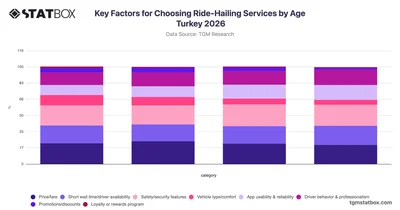
Discover how age shapes ride-hailing service priorities in Turkey with TGM StatBox data covering price, safety, app usability, and driver behavior across key demographics.
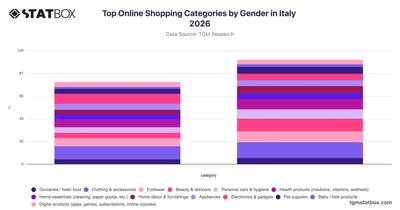
Explore TGM StatBox data on Italy's top online shopping categories by gender in 2026, where women lead in clothing and beauty while men dominate electronics.
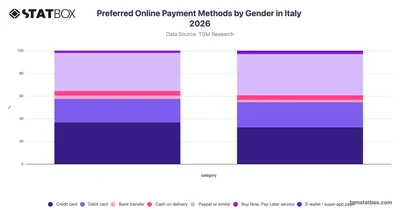
Explore how Italian men and women prefer credit cards and PayPal for online payments in 2026 with gender-split insights on TGM StatBox.
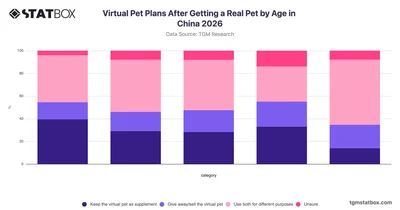
Explore how different age groups in China plan to manage virtual pets after getting a real one, with full survey data by age on TGM StatBox.
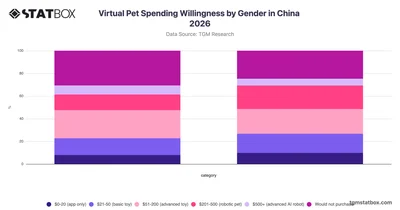
Compare virtual pet spending willingness by gender in China with TGM StatBox, covering purchase intent across price tiers from app-only to advanced AI robots.
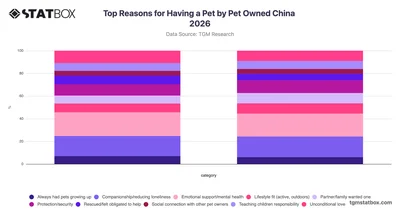
Explore why cat and dog owners in China choose to have pets with this TGM StatBox chart covering key motivations from companionship to emotional support.
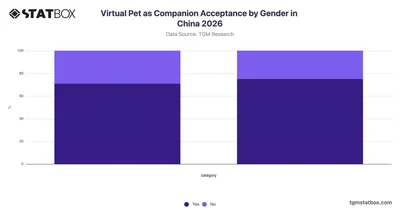
Explore how Chinese men and women feel about accepting virtual pets as companions in 2026, with gender-based data available on TGM StatBox.
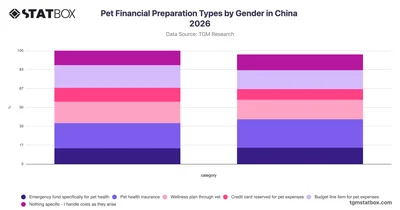
Explore how male and female pet owners in China approach financial preparation for pet costs with gender-based data from TGM StatBox.
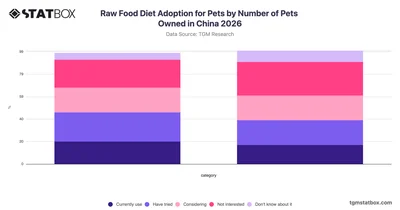
Explore how raw food diet adoption for pets varies by number of pets owned in China with clear survey data from TGM StatBox.
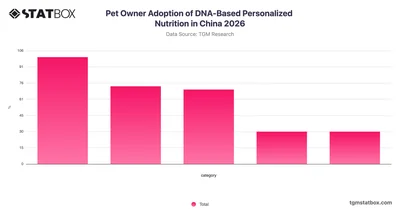
Explore how pet owners in China are adopting DNA-based personalized nutrition, with TGM StatBox data revealing attitudes from current users to the unaware.
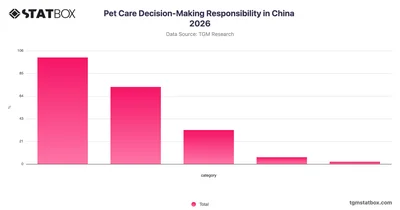
Explore how pet care decisions are made within households in China with this TGM StatBox chart on decision-making responsibility among pet owners.
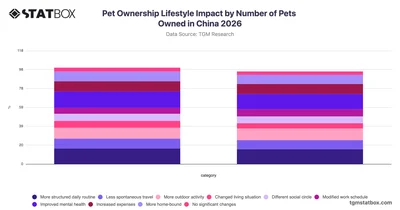
Explore how pet ownership shapes daily lifestyle in China across single and multi-pet owners with TGM StatBox data on routines, expenses, and wellbeing.
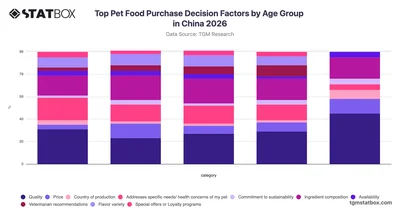
Explore how pet food purchase decisions vary across age groups in China with this TGM StatBox chart covering quality, price, ingredients, and more.
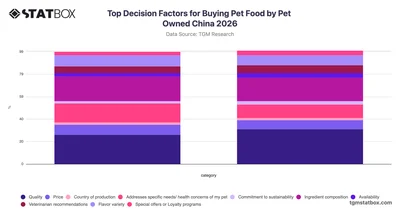
Explore what drives pet food purchasing decisions among cat and dog owners in China with this TGM StatBox breakdown of key decision factors for 2026.
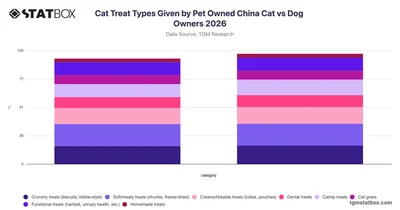
Compare cat treat preferences among cat and dog owners in China with this TGM StatBox chart covering treat types from crunchy and soft to functional and homemade.
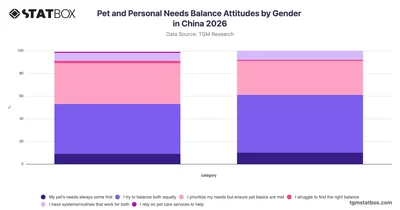
Explore how men and women in China balance their own needs with their pet's care in this TGM StatBox breakdown of attitudes by gender for 2026.
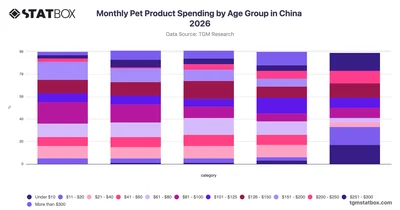
Explore how monthly pet product spending varies across age groups in China with this 2026 TGM StatBox chart covering a full range of spending brackets.
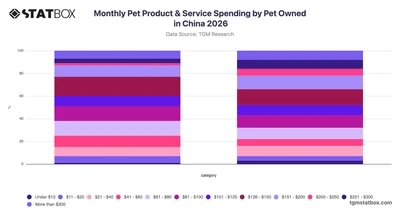
Explore monthly pet product and service spending patterns among cat and dog owners in China with this 2026 TGM StatBox breakdown of spending ranges.
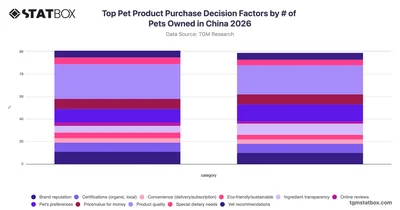
Compare pet product purchase decision factors between single and multi-pet owners in China with this 2026 TGM StatBox chart covering key buying influences.
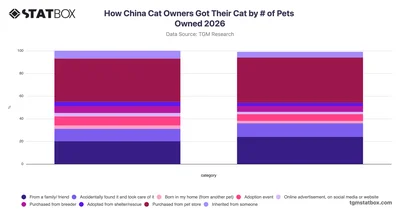
Explore how China cat owners acquired their pets by number of pets owned in 2026, comparing single and multi-pet owners with TGM StatBox.
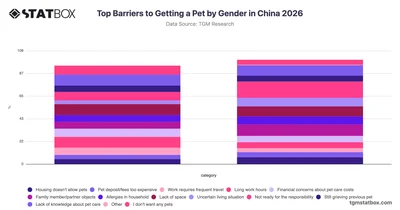
Explore gender differences in the barriers preventing people from getting a pet in China with this TGM StatBox chart covering key factors for males and females.
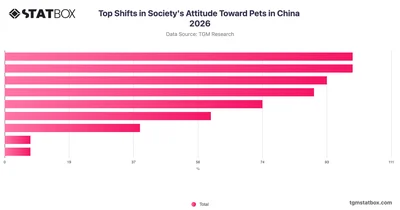
Explore how society's attitude toward pets is shifting in China with TGM StatBox data covering public spaces, social media, and emotional support recognition.
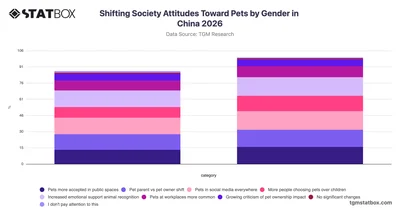
Explore how male and female attitudes toward pets are shifting across Chinese society in 2026 with gender-based data from TGM StatBox.
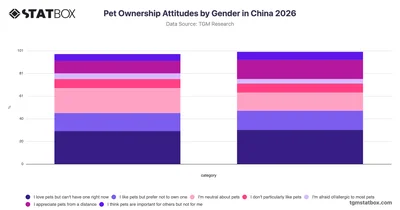
Explore pet ownership attitudes by gender in China with TGM StatBox, revealing how men and women feel about having or living without pets.
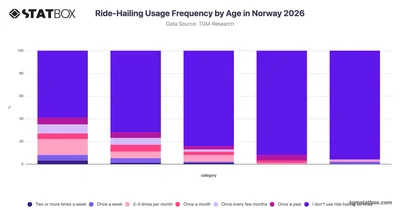
Explore how frequently different age groups in Norway use ride-hailing services with TGM StatBox data covering usage patterns from 2026.
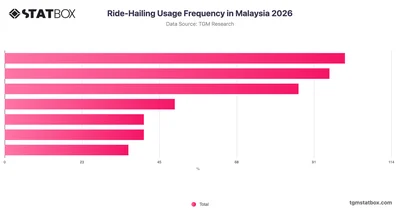
Explore ride-hailing usage frequency in Malaysia with TGM StatBox, covering how often Malaysians use these services in 2026.
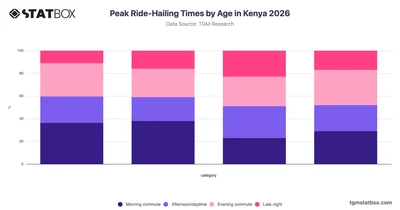
Explore how ride-hailing usage times vary across age groups in Kenya with this TGM StatBox chart covering morning, daytime, evening, and late-night patterns.
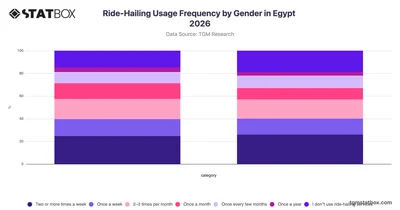
Explore ride-hailing usage frequency by gender in Egypt with TGM StatBox, covering how often men and women use these services across key usage tiers.






