Insights library
Not sure where to start? Dive into a diverse selection of charts and data visualizations across topics, and find the information you need to drive your research and analysis.
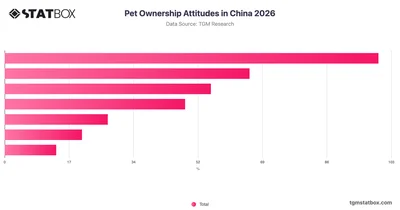

Explore pet ownership attitudes in China with TGM StatBox, covering how people feel about pets, from affection to indifference, across key sentiment categories.
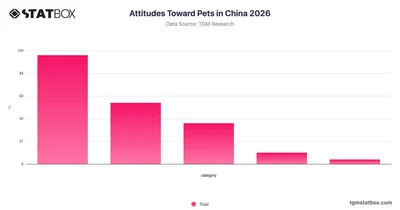
Explore attitudes toward pets among the total population in China with this 2026 TGM StatBox chart covering a range of opinions from love to aversion.
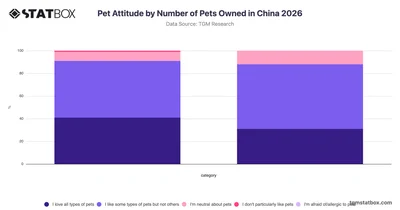
Explore how pet ownership type shapes attitudes toward pets in China with this TGM StatBox chart comparing single and multi-pet owners.
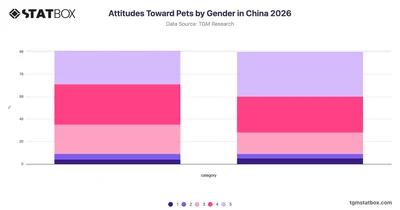
Compare attitudes toward pets by gender in China with 2026 survey data from TGM StatBox, revealing how men and women differ in their views on pet ownership.
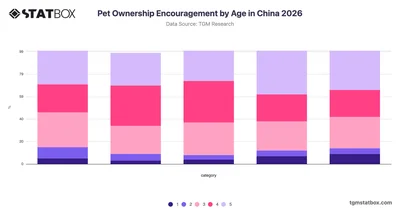
Explore how different age groups in China respond to pet ownership encouragement with this 2026 TGM StatBox breakdown of survey data across five demographics.
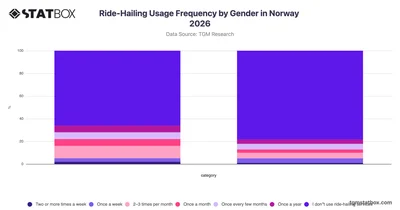
Explore ride-hailing usage frequency by gender in Norway with TGM StatBox, covering how often men and women use these services in 2026.
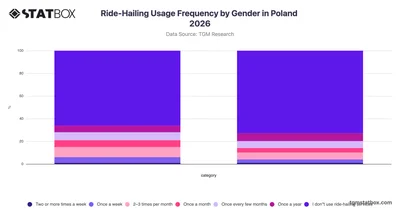
Explore ride-hailing usage frequency by gender in Poland with TGM StatBox, revealing how often men and women use these services across key frequency categories.
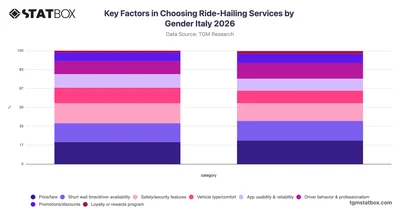
Explore how male and female users in Italy prioritize different factors when choosing ride-hailing services, with full data available on TGM StatBox.
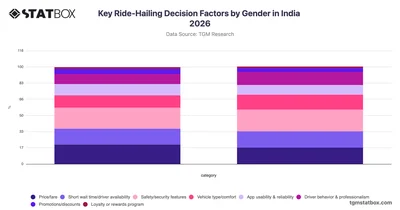
Compare how male and female riders in India prioritize ride-hailing decision factors, from safety to pricing, with TGM StatBox's 2026 gender breakdown.
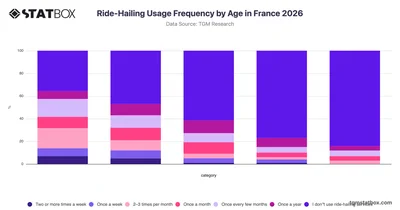
Explore how ride-hailing usage frequency varies across age groups in France with TGM StatBox, covering everything from weekly riders to non-users.
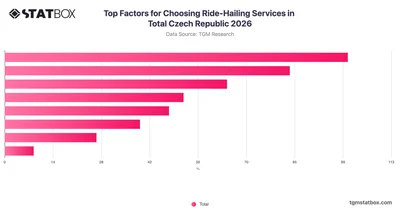
Explore what drives ride-hailing service choices in Czech Republic with key consumer preference data from TGM StatBox, covering price, safety, app usability, and more.
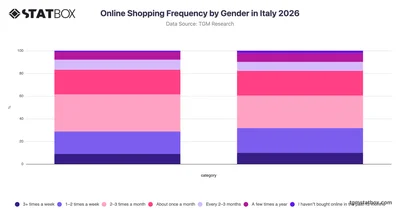
Explore Italy's 2026 online shopping frequency by gender on TGM StatBox — most Italians shop a few times a month, with weekly purchases common among both men and women.
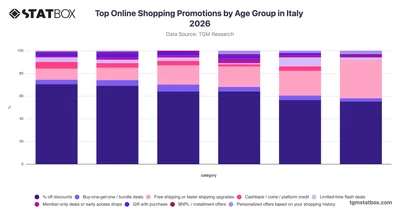
Explore TGM StatBox data on Italy's top online shopping promotions by age group, where percentage discounts dominate across all ages while free shipping is especially valued by older shoppers.
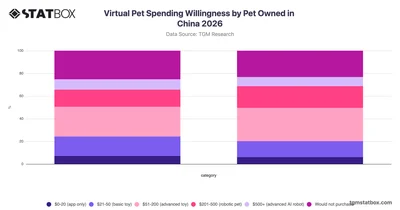
Explore virtual pet spending willingness among cat and dog owners in China with TGM StatBox, covering a range of price tiers from apps to advanced AI robots.
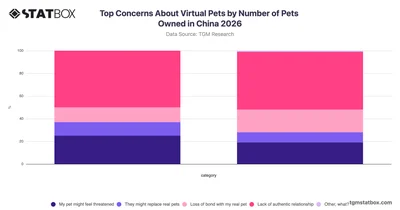
Explore how concerns about virtual pets differ between single and multi-pet owners in China with this TGM StatBox chart covering key worries like authenticity and real pet bonds.
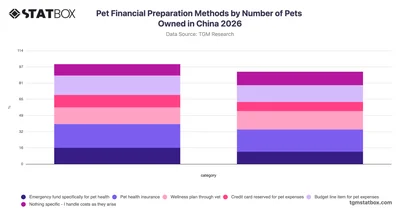
Explore how pet owners in China prepare financially for pet costs, comparing single and multi-pet households, with TGM StatBox survey data from 2026.
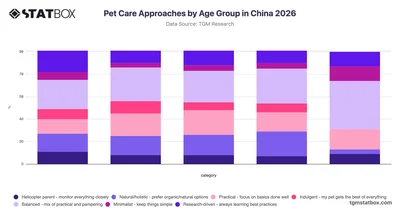
Explore how different age groups in China approach pet care in 2026 with this TGM StatBox breakdown of parenting styles, from minimalist to indulgent.
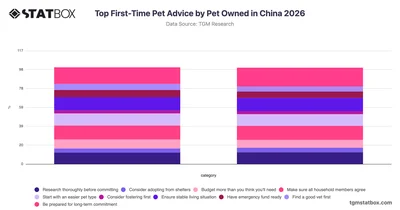
Explore first-time pet advice among cat and dog owners in China with this TGM StatBox chart covering key considerations from budgeting to long-term commitment.
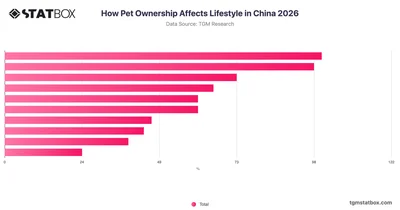
Explore how pet ownership shapes daily lifestyle habits in China with TGM StatBox, covering routines, mental health, social life, and spending patterns.
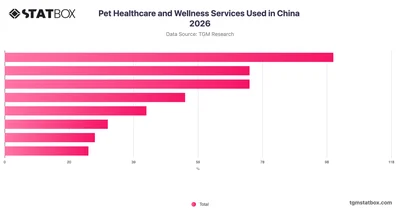
Explore pet healthcare and wellness service usage among Chinese consumers in 2026 with this TGM StatBox chart covering veterinary care, insurance, and more.
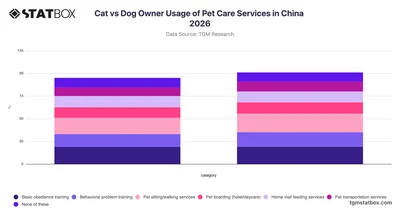
Compare cat and dog owner usage of pet care services in China with TGM StatBox, covering training, boarding, sitting, and home visit options.
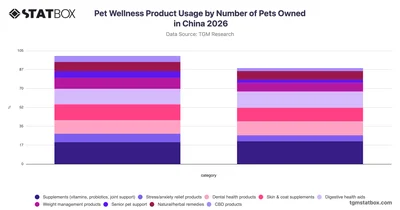
Compare pet wellness product usage among single and multi-pet owners in China with this TGM StatBox chart covering supplements, dental, digestive, and other health categories.
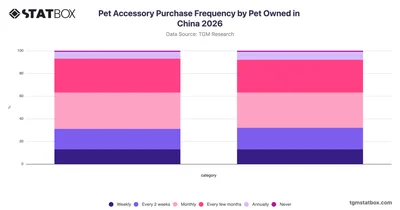
Explore how frequently cat and dog owners in China purchase pet accessories in 2026 with this TGM StatBox chart covering key buying intervals.
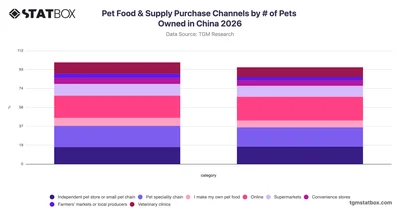
Explore how single and multi-pet owners in China purchase pet food and supplies across key channels in 2026 with TGM StatBox.
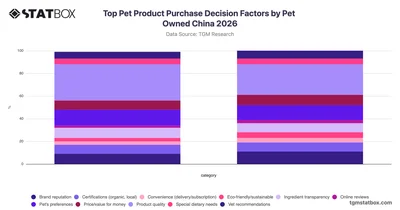
Explore pet product purchase decision factors for cat and dog owners in China with this 2026 TGM StatBox chart covering quality, brand, price, and more.
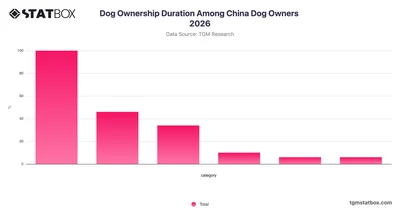
Explore dog ownership duration trends among China dog owners with real survey data from TGM StatBox, covering how long people have kept their pets.
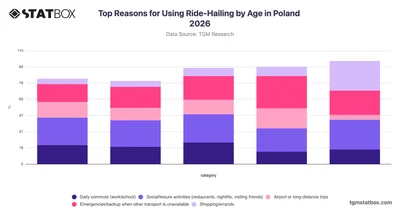
Explore why different age groups in Poland use ride-hailing services with TGM StatBox data covering commuting, leisure, errands, and more.
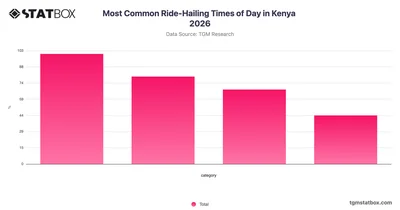
Explore how Kenyans use ride-hailing services throughout the day with TGM StatBox data on the most common travel times across Kenya in 2026.
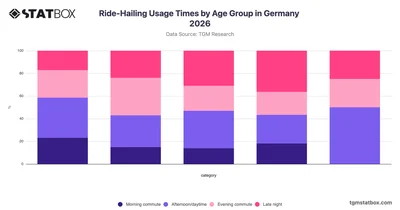
Explore how ride-hailing usage times vary across age groups in Germany with this TGM StatBox chart covering morning, daytime, evening, and late-night patterns.
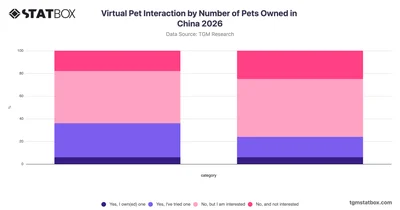
Compare virtual pet interaction rates among single and multi-pet owners in China with this TGM StatBox chart covering ownership and interest levels across both groups.






