Insights library
Not sure where to start? Dive into a diverse selection of charts and data visualizations across topics, and find the information you need to drive your research and analysis.
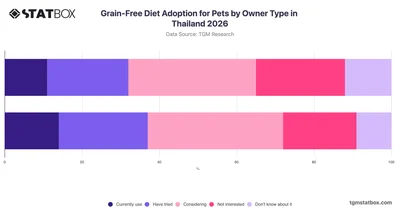

Explore grain-free diet adoption for pets in Thailand 2026 with TGM StatBox, comparing awareness and usage trends among cat and dog owners.
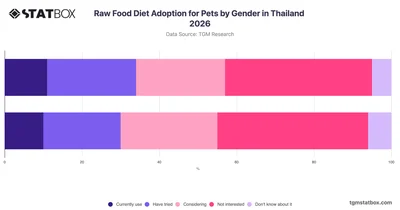
Explore raw food diet adoption for pets by gender in Thailand 2026 with TGM StatBox, comparing awareness, usage, and interest levels between men and women.
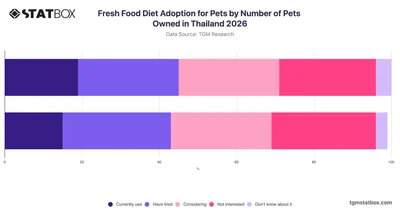
Explore fresh food diet adoption for pets by ownership type in Thailand 2026 with TGM StatBox, comparing single and multi-pet owner attitudes.
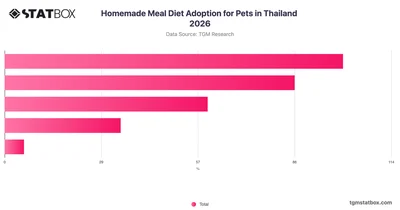
Explore homemade meal diet adoption for pets in Thailand 2026 with TGM StatBox, covering awareness, trial, and interest levels among Thai pet owners.
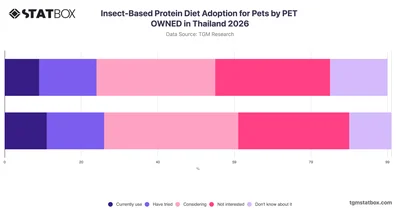
Explore insect-based protein diet adoption for pets in Thailand 2026 by pet type with TGM StatBox, comparing cat and dog owners' awareness and usage.
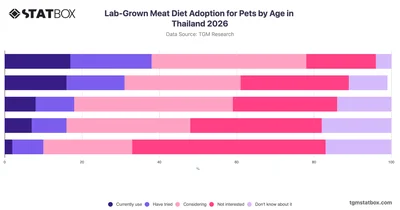
Explore how lab-grown meat diet adoption for pets varies by age group in Thailand with 2026 data from TGM StatBox, covering current use to awareness levels.
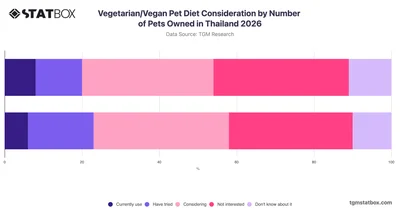
Explore how Thai single and multi-pet owners consider vegetarian and vegan diets for their pets in Thailand 2026 with TGM StatBox.
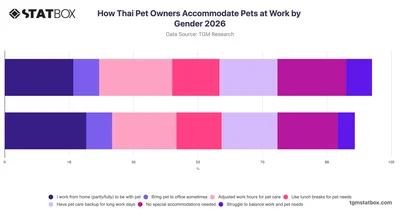
Explore how male and female pet owners in Thailand accommodate pets at work in 2026, from remote work to adjusted hours, with TGM StatBox.
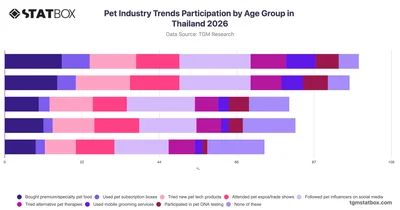
Explore 2026 pet industry trends participation by age group in Thailand with TGM StatBox, covering premium food, pet tech, grooming, and more.
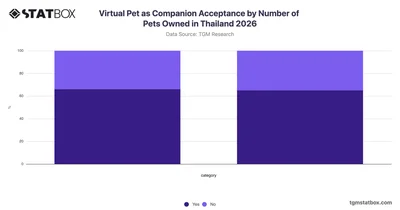
Explore virtual pet companion acceptance in Thailand 2026 by pet ownership type, comparing single and multi-pet owners with TGM StatBox.
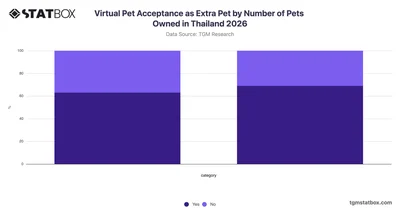
Explore how Thai single and multi-pet owners in Thailand view virtual pets as extra companions in 2026 with data from TGM StatBox.
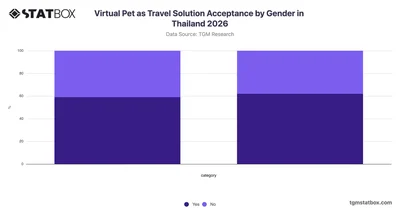
Explore virtual pet acceptance as a travel solution in Thailand 2026 by gender with TGM StatBox, comparing male and female perspectives.
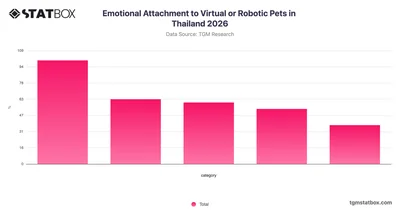
Explore how people in Thailand emotionally connect with virtual or robotic pets in 2026 with survey data from TGM StatBox.
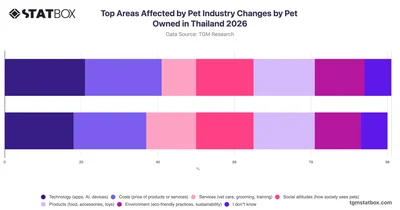
Explore how pet industry changes across technology, costs, services, and more affect cat and dog owners in Thailand 2026 with TGM StatBox.
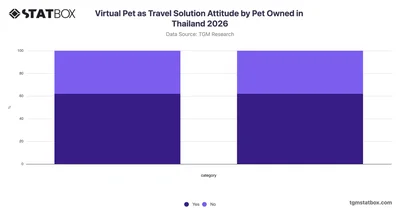
Explore attitudes toward virtual pets as a travel solution in Thailand 2026 by pet ownership type, with cat and dog owner data, via TGM StatBox.
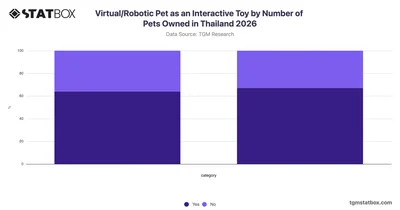
Compare attitudes toward virtual and robotic pets as interactive toys by number of pets owned in Thailand 2026 with data from TGM StatBox.
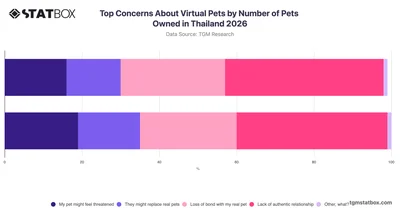
Explore how pet owners in Thailand 2026 feel about virtual pets, comparing top concerns between single and multi-pet owners, with data from TGM StatBox.
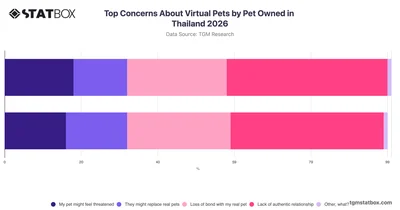
Explore concerns about virtual pets among cat and dog owners in Thailand 2026 with this TGM StatBox breakdown of key worries shaping real pet relationships.
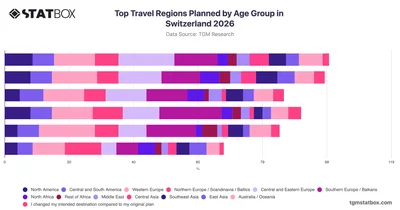
Explore how travel region preferences for 2026 vary across age groups in Switzerland with this TGM StatBox breakdown of planned destinations.
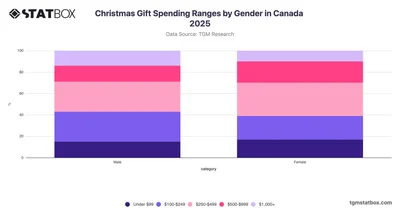
Compare Christmas gift spending ranges by gender in Canada with TGM StatBox, exploring how male and female budgets differ across key price brackets.
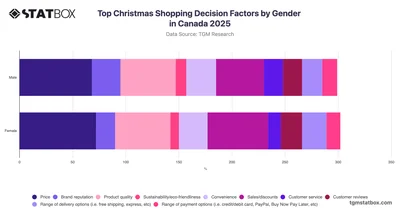
Explore how Christmas shopping decision factors differ by gender in Canada with this TGM StatBox chart covering price, quality, discounts, and more.
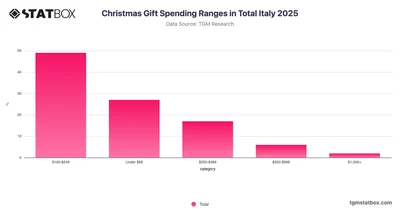
Explore Christmas gift spending ranges in Italy with TGM StatBox, revealing how Italian consumers distribute their holiday budgets across key price tiers.
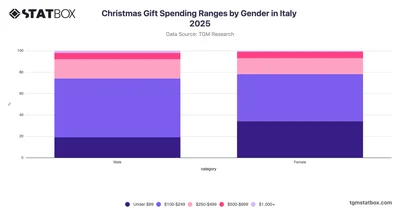
Compare Christmas gift spending ranges by gender in Italy with TGM StatBox, exploring how men and women allocate their holiday budgets across different price tiers.
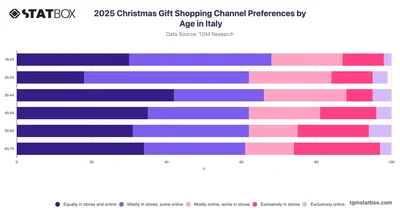
Explore how Italian consumers across age groups prefer to shop for Christmas gifts in stores, online, or both, with data from TGM StatBox.
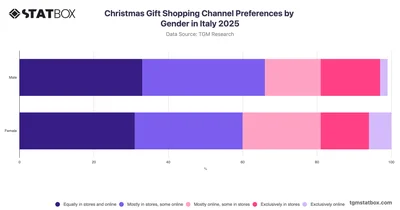
Explore how male and female shoppers in Italy prefer to buy Christmas gifts across online and in-store channels with TGM StatBox.
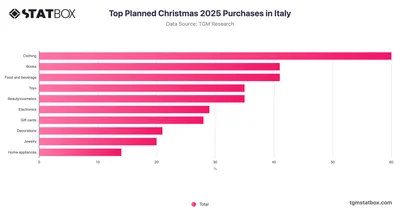
Explore insights into planned Christmas 2025 purchases in Italy with category-level data from TGM StatBox, covering gifts, food, travel, and more.
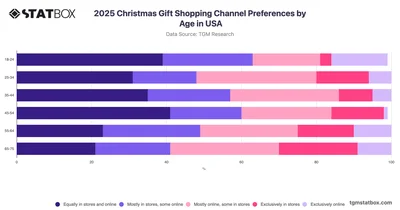
Explore how Americans across age groups prefer to shop for Christmas gifts in stores, online, or both, with data from TGM StatBox.
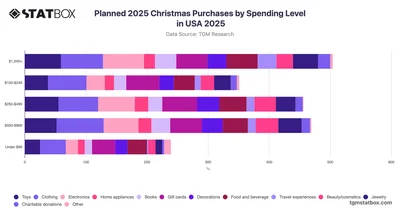
Explore how Christmas 2025 purchase plans in the USA vary by spending level across categories like clothing, electronics, and gifts with TGM StatBox.
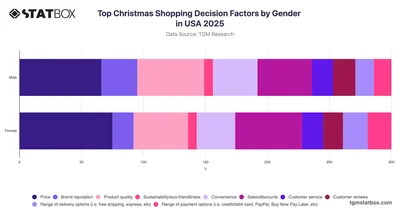
Explore how Christmas shopping decision factors differ by gender in the USA with this TGM StatBox chart covering price, quality, discounts, and more.
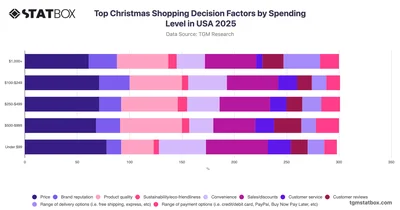
Explore Christmas shopping decision factors by spending level in the USA with TGM StatBox, comparing how price, quality, and convenience vary across budgets.






