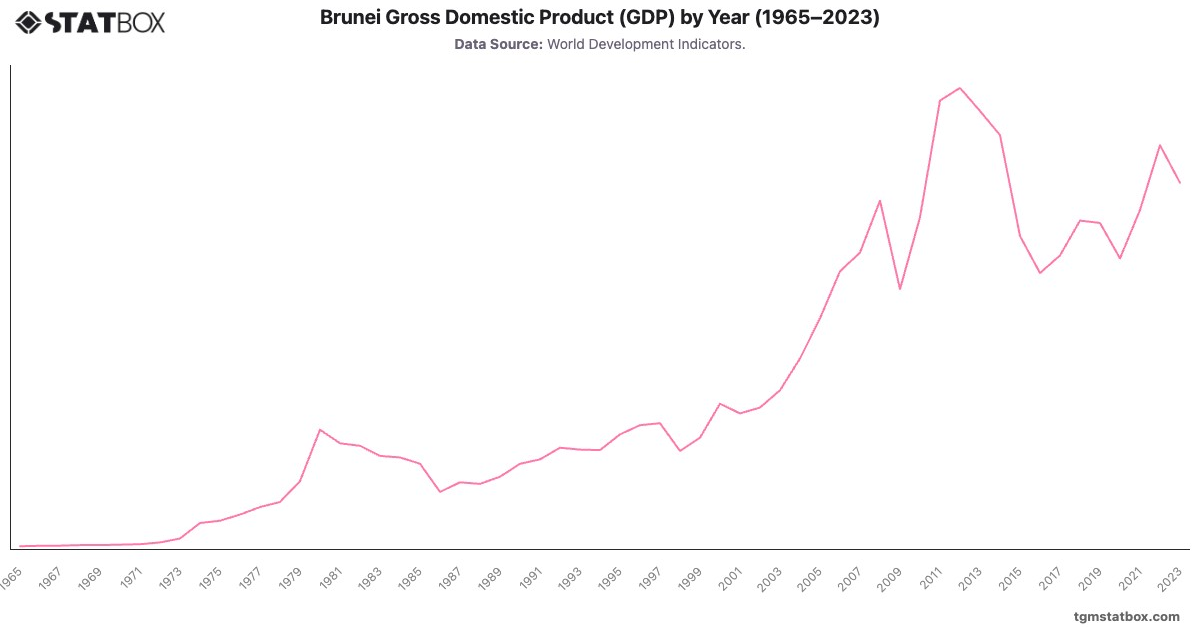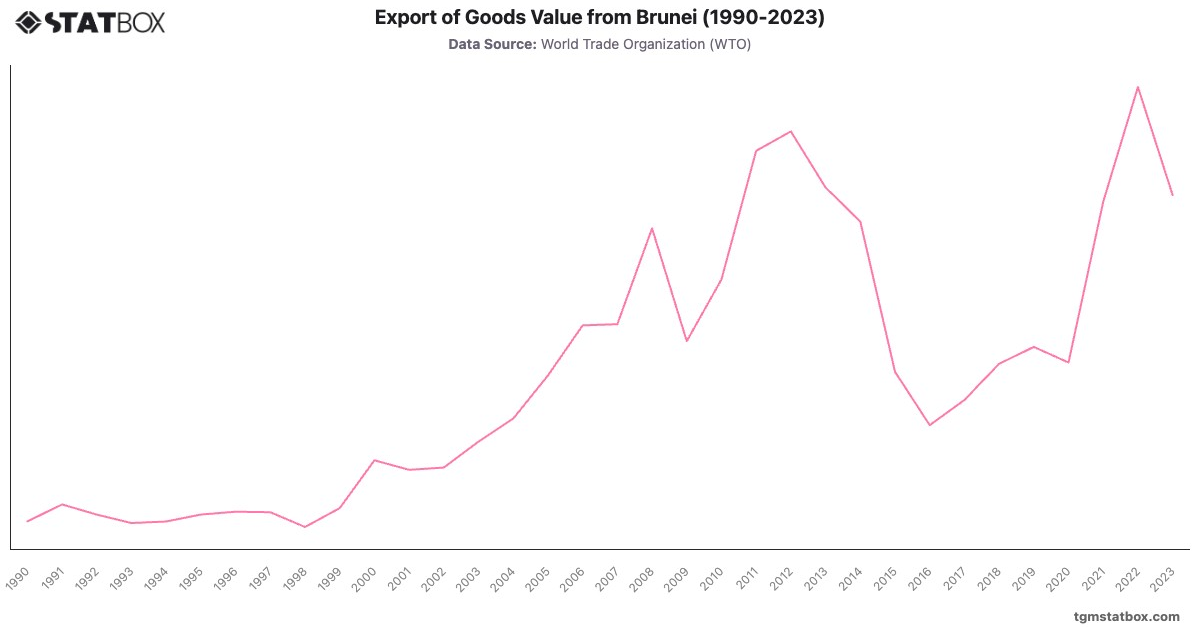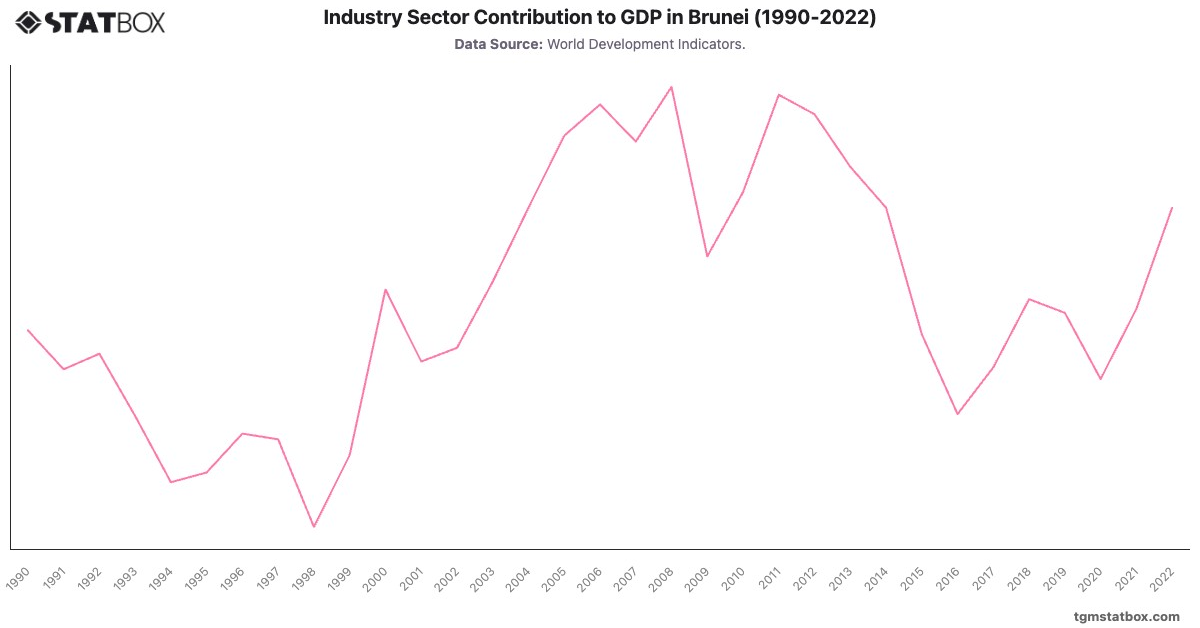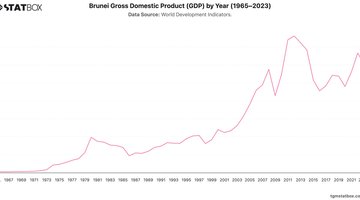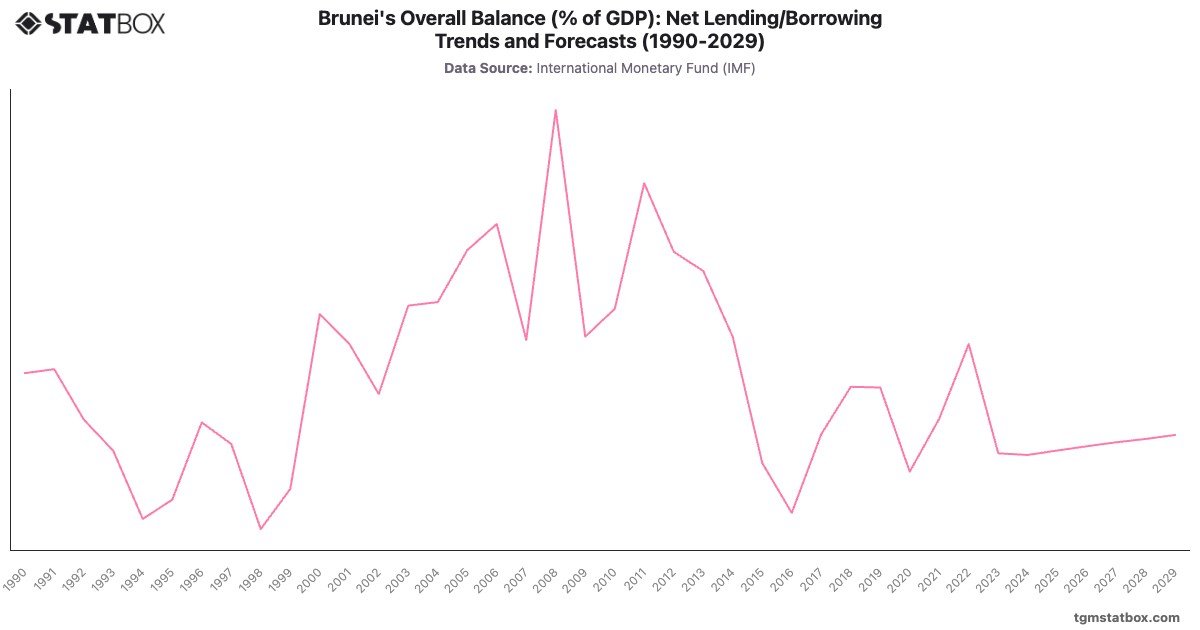
Brunei’s fiscal history is deeply tied to oil and gas revenues, with significant volatility reflecting global energy price fluctuations. The 1990s witnessed large deficits, peaking at - in 1998, during a period of declining oil revenues and economic challenges. A sharp turnaround occurred in the early 2000s, with surpluses reaching of GDP in 2008 due to high energy prices.
Post-2014, oil price collapses pushed Brunei back into deficits, peaking at - in 2016. While a temporary recovery occurred in 2022 with a surplus of , the outlook for 2023-2029 suggests persistent deficits around -, highlighting the need for economic diversification and fiscal reforms to reduce dependency on hydrocarbons.
Post-2014, oil price collapses pushed Brunei back into deficits, peaking at - in 2016. While a temporary recovery occurred in 2022 with a surplus of , the outlook for 2023-2029 suggests persistent deficits around -, highlighting the need for economic diversification and fiscal reforms to reduce dependency on hydrocarbons.
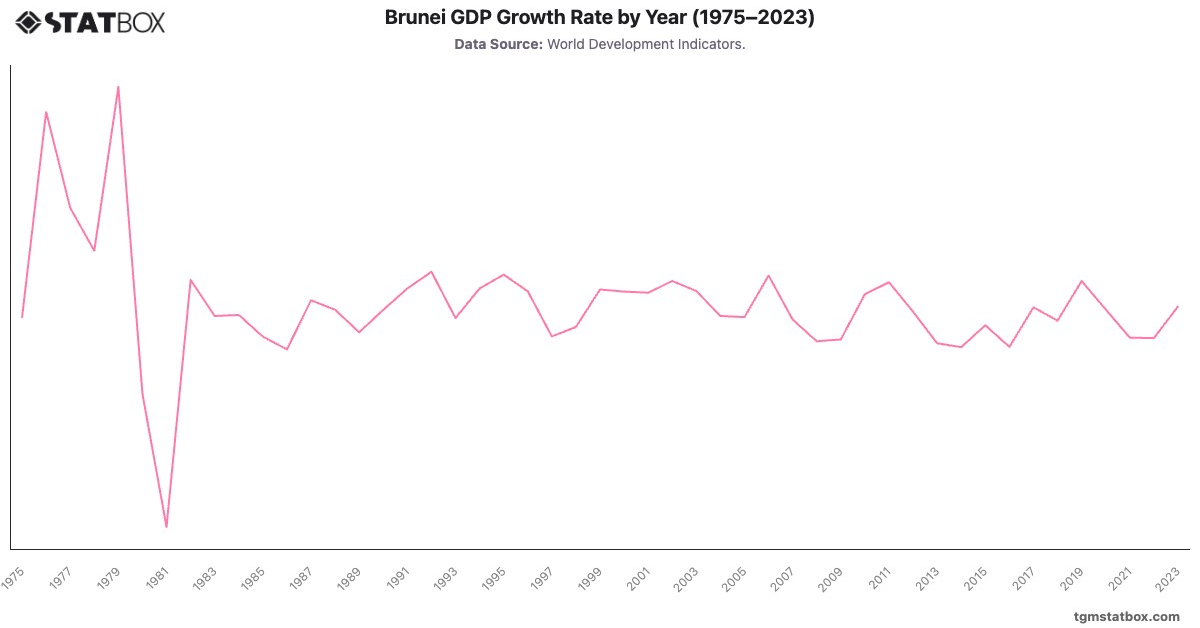
For additional information, visit statistics on Brunei’s central government debt to GDP ratio, Brunei’s annual GDP growth rate, Brunei’s annual GDP.