Chile GDP Growth Rate (1961–2023)
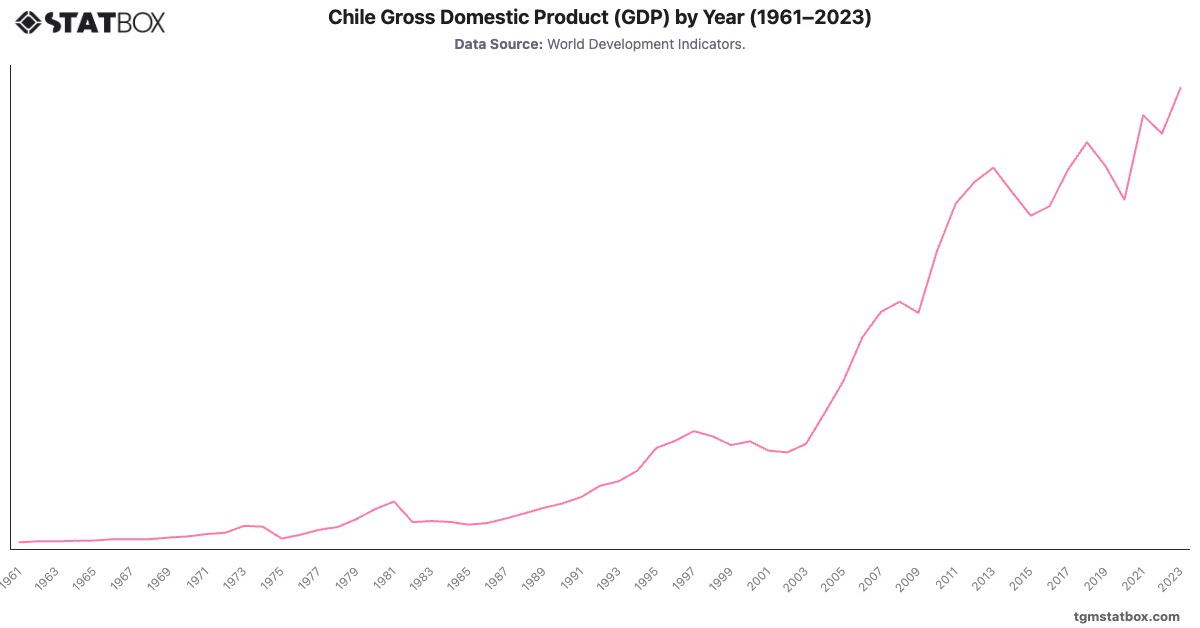
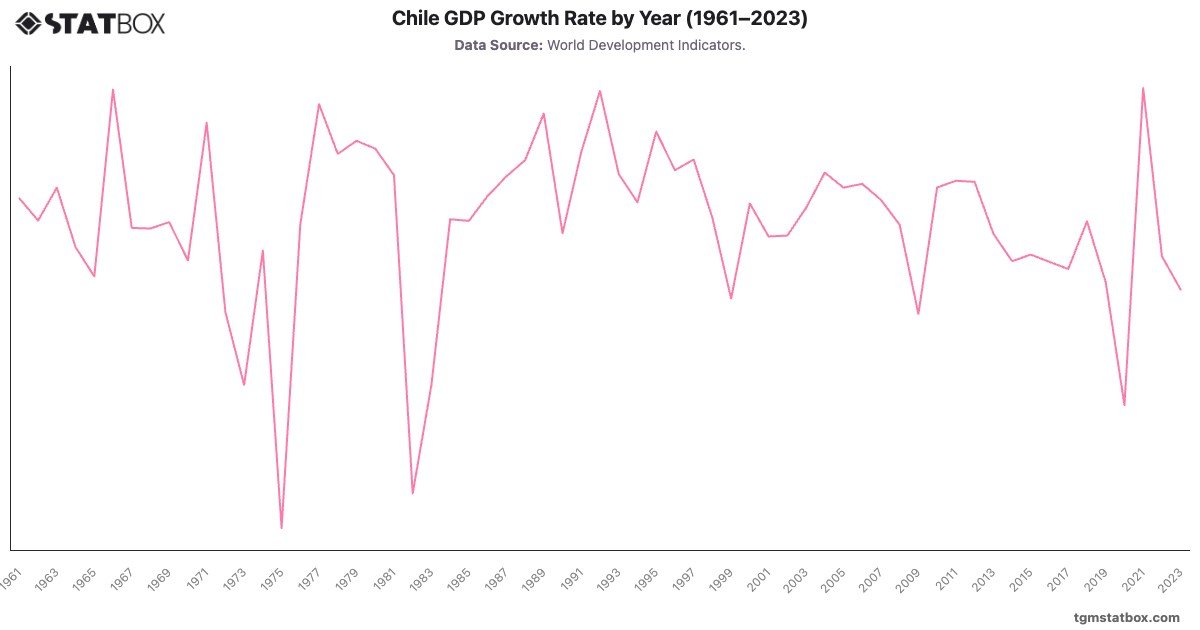
Chile's economic trajectory reflects dramatic shifts driven by political and economic reforms, external shocks, and structural adjustments. In the 1960s, growth varied, with a notable in 1966. The 1970s were tumultuous, with a steep decline of - in 1975 due to economic turmoil following political upheavals and the implementation of new economic policies.
The 1980s and 1990s marked a period of economic liberalization and strong recovery, with growth peaking at in 1992, propelled by export diversification and a free-market economy. However, the Asian financial crisis of 1998 triggered a contraction and slowed growth to - in 1999.
Chile’s growth remained moderate until the global financial crisis in 2009, which resulted in a - contraction. The economy rebounded, with a peak of in 2021, driven by a commodities boom and stimulus efforts following the pandemic-induced - in 2020. Growth slowed to in 2023, reflecting global headwinds and internal economic adjustments.
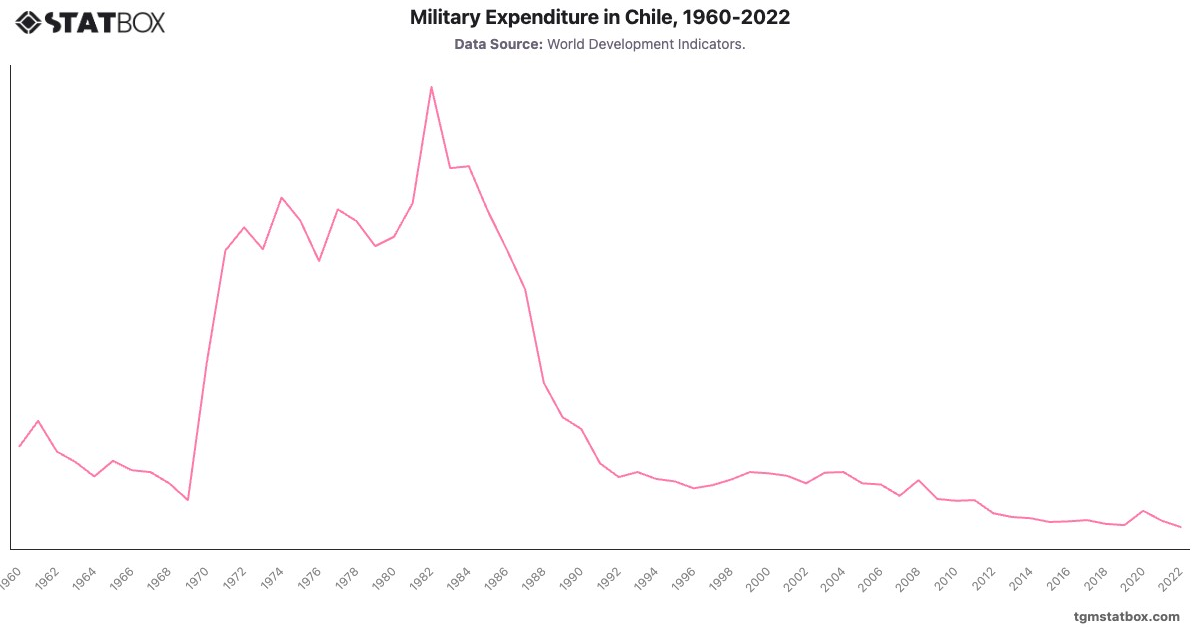
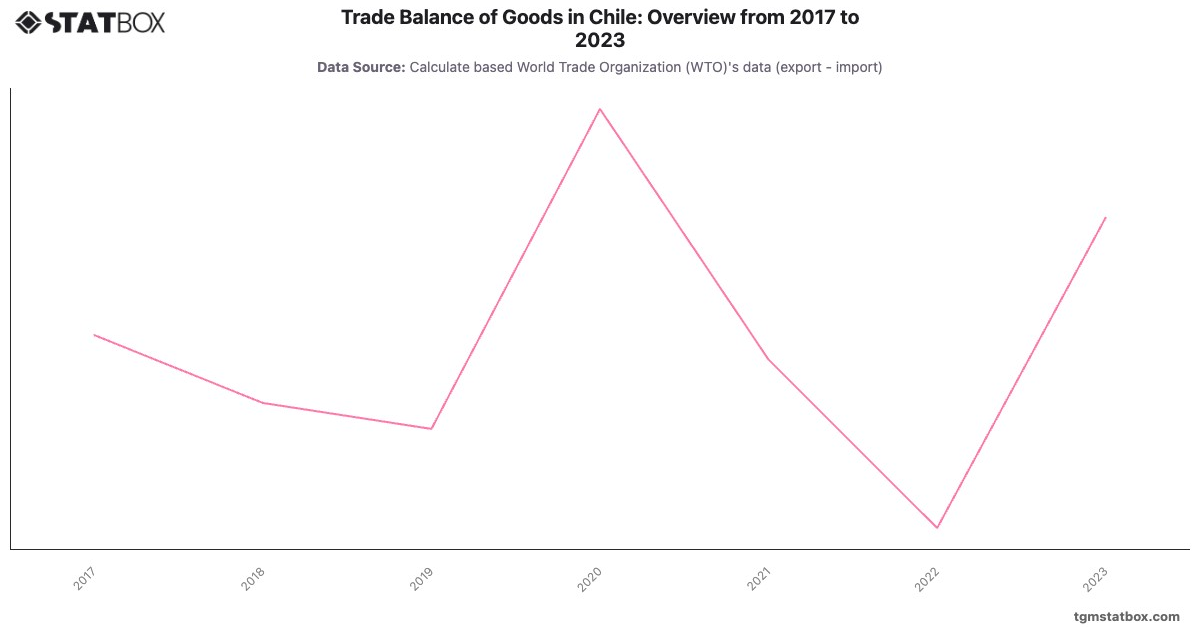
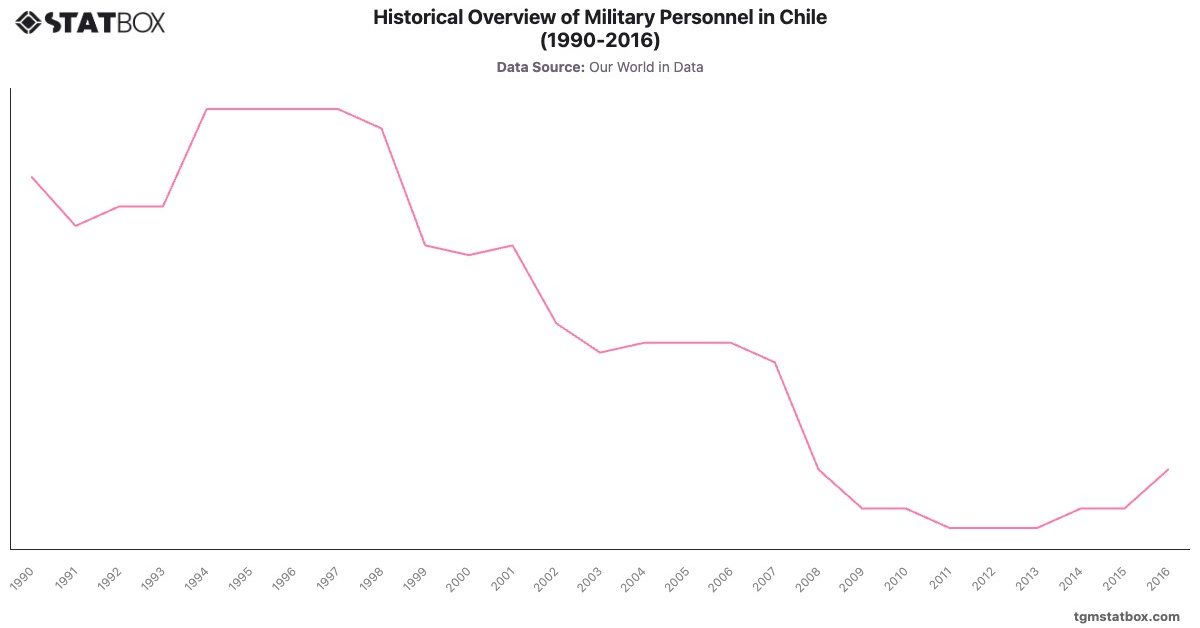
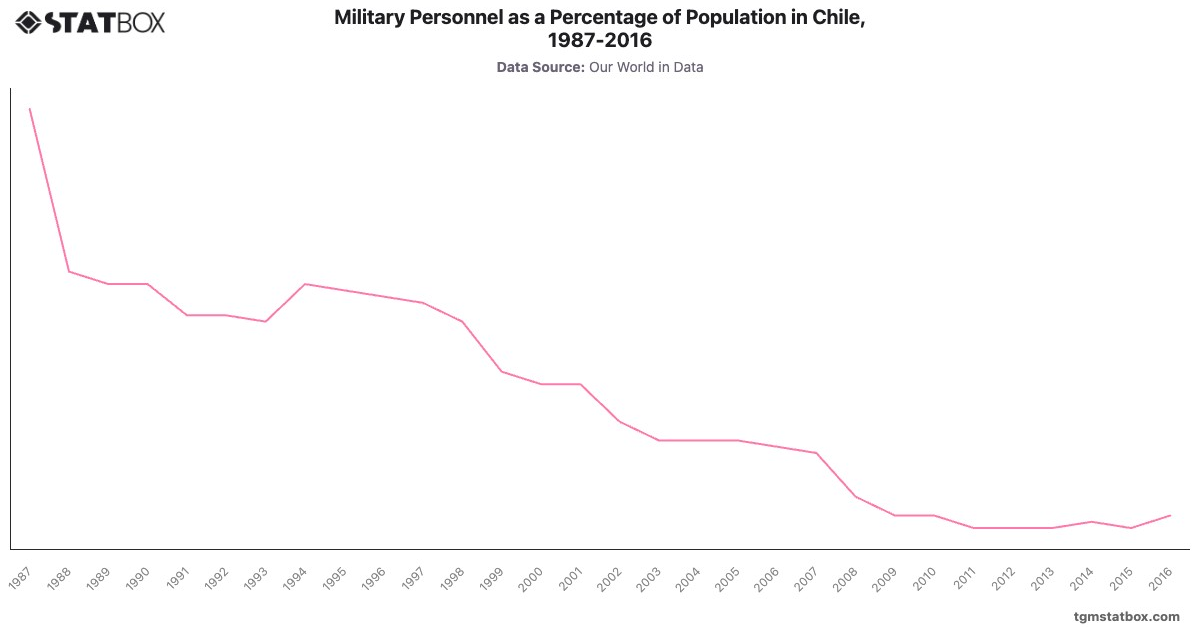
Discover additional trends and data on Chile’s military personnel proportion, Chile’s goods exports value, Chile’s unemployment rate trends.