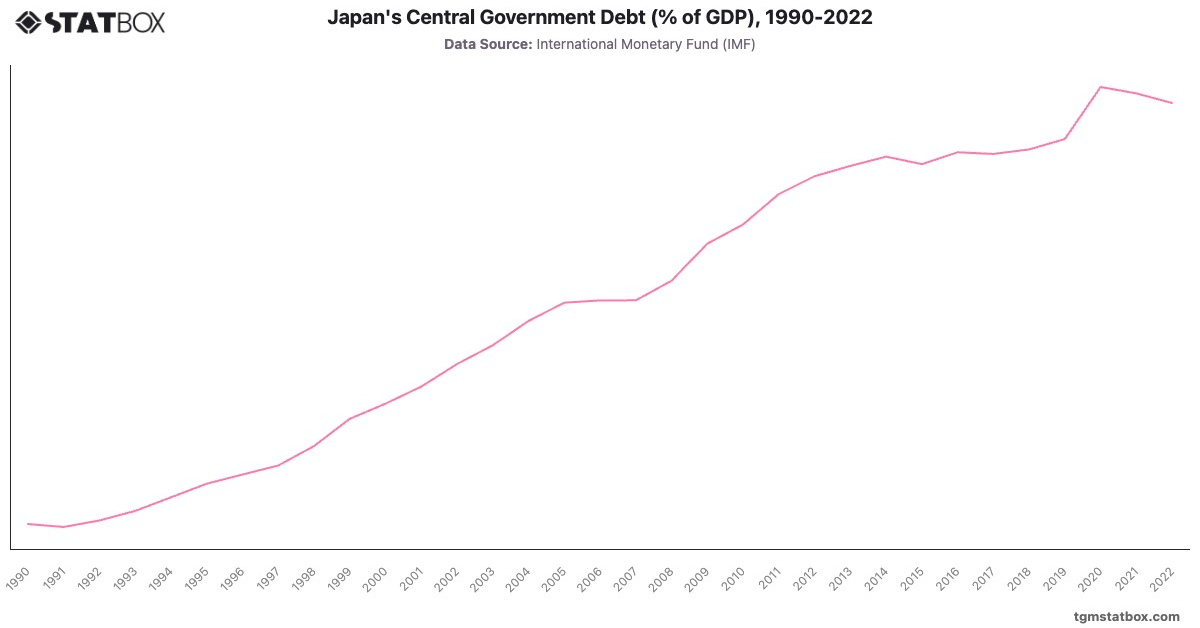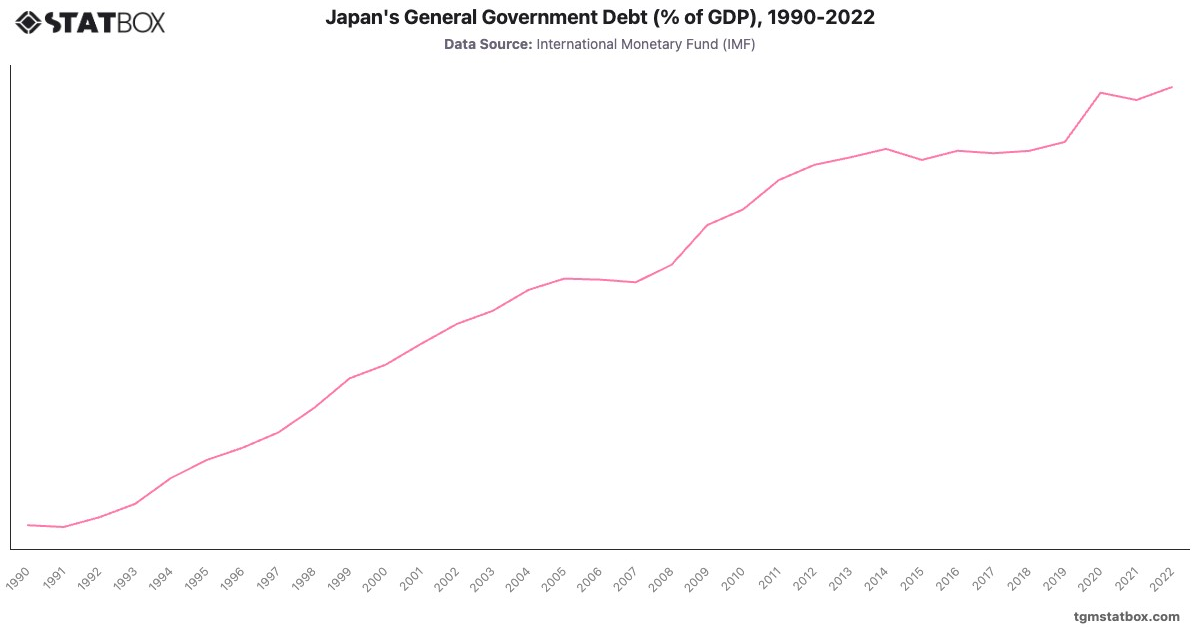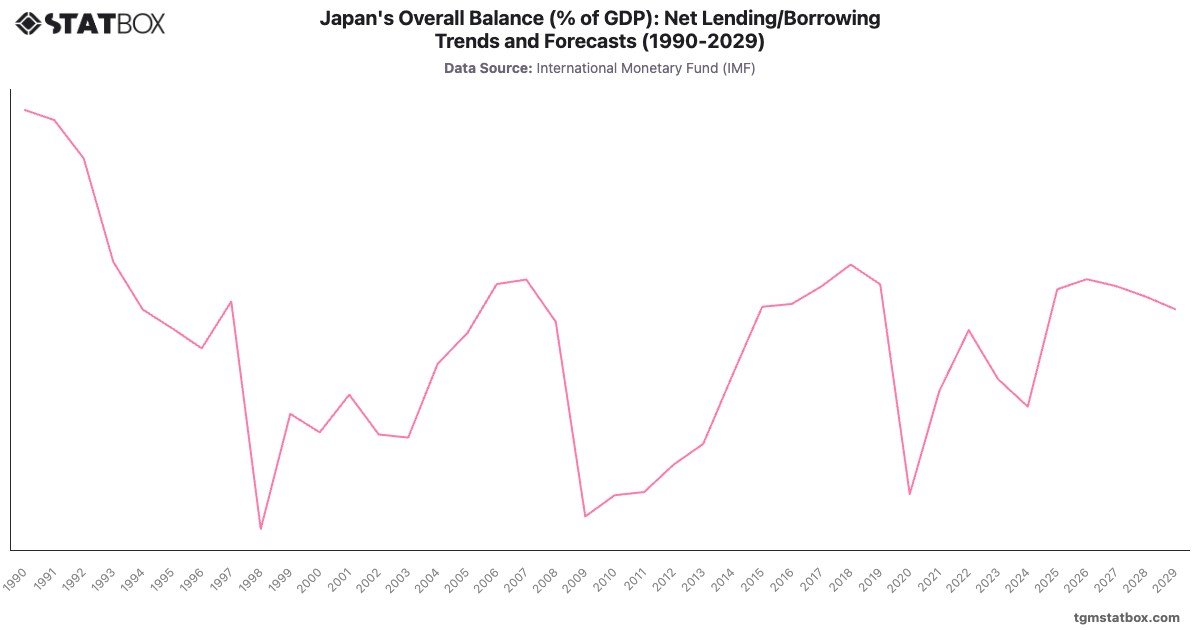
Japan’s fiscal trends highlight the long-term impact of economic stagnation and demographic challenges. The early 1990s began with a surplus of , but the burst of the asset bubble led to widening deficits, reaching - in 1998. Efforts to stimulate the economy through fiscal spending maintained persistent deficits.
The COVID-19 pandemic deepened fiscal pressures, with deficits peaking at - in 2020. Although recovery is projected, with deficits narrowing to - by 2029, Japan's fiscal challenges are exacerbated by an aging population and high public debt.
The COVID-19 pandemic deepened fiscal pressures, with deficits peaking at - in 2020. Although recovery is projected, with deficits narrowing to - by 2029, Japan's fiscal challenges are exacerbated by an aging population and high public debt.
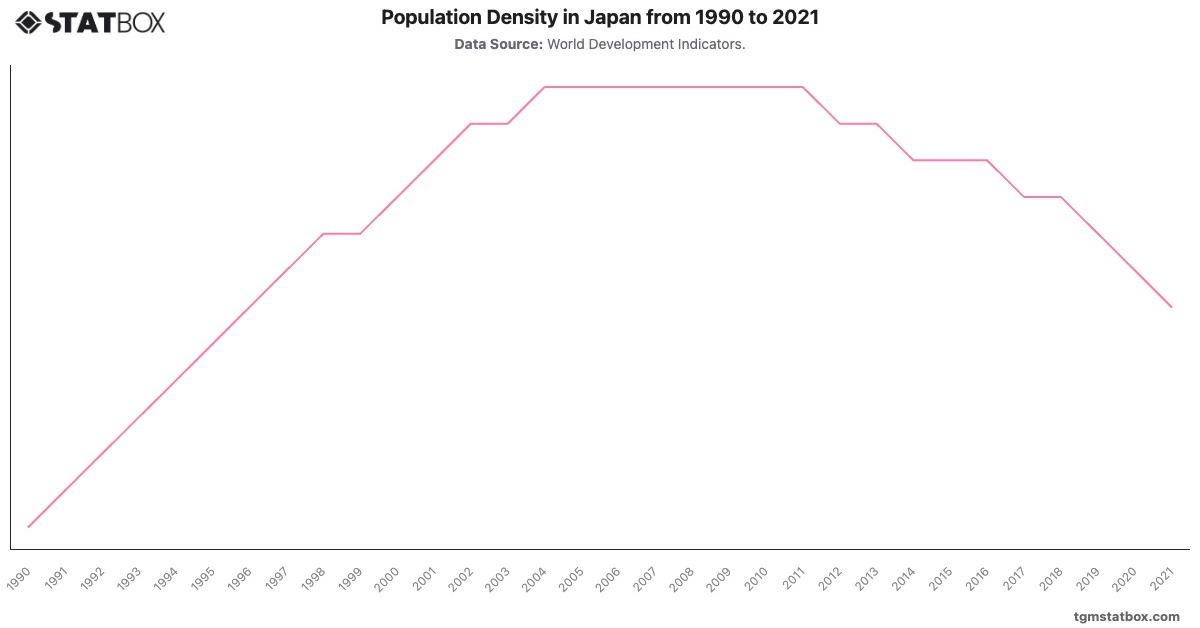
Find out more through related statistics on Japan’s population density estimate, Japan’s central government debt-to-GDP ratio, Japan’s population data.