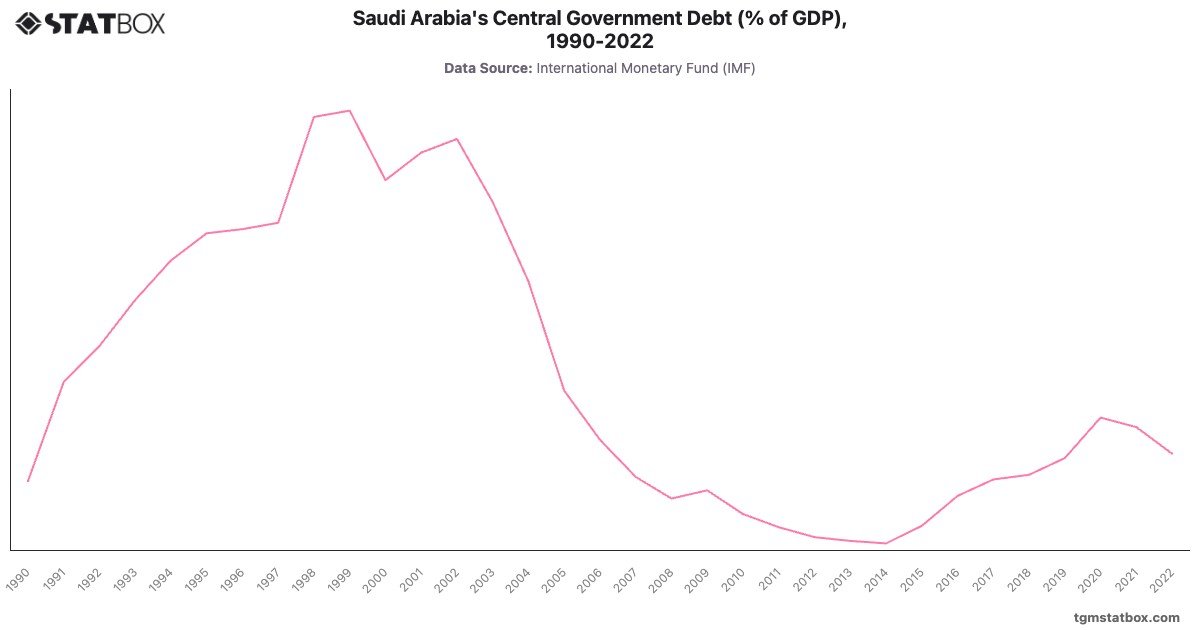
Saudi Arabia experienced significant shifts in its central government debt as it navigated oil price volatility and fiscal policy challenges. Debt rose sharply from in 1990 to over by 1999, driven by deficits during the Gulf War and declining oil revenues. However, a turnaround began in the 2000s, supported by rising oil prices and fiscal reforms. By 2008, debt had dropped to , underscoring prudent fiscal management and oil revenue windfalls.
The 2015 oil price crash reignited borrowing, with debt rising to by 2019. The COVID-19 pandemic further strained finances, pushing the debt-to-GDP ratio to in 2020. Despite fiscal reforms and economic diversification under Vision 2030, debt only partially eased to in 2022, reflecting ongoing efforts to balance growth and fiscal stability.
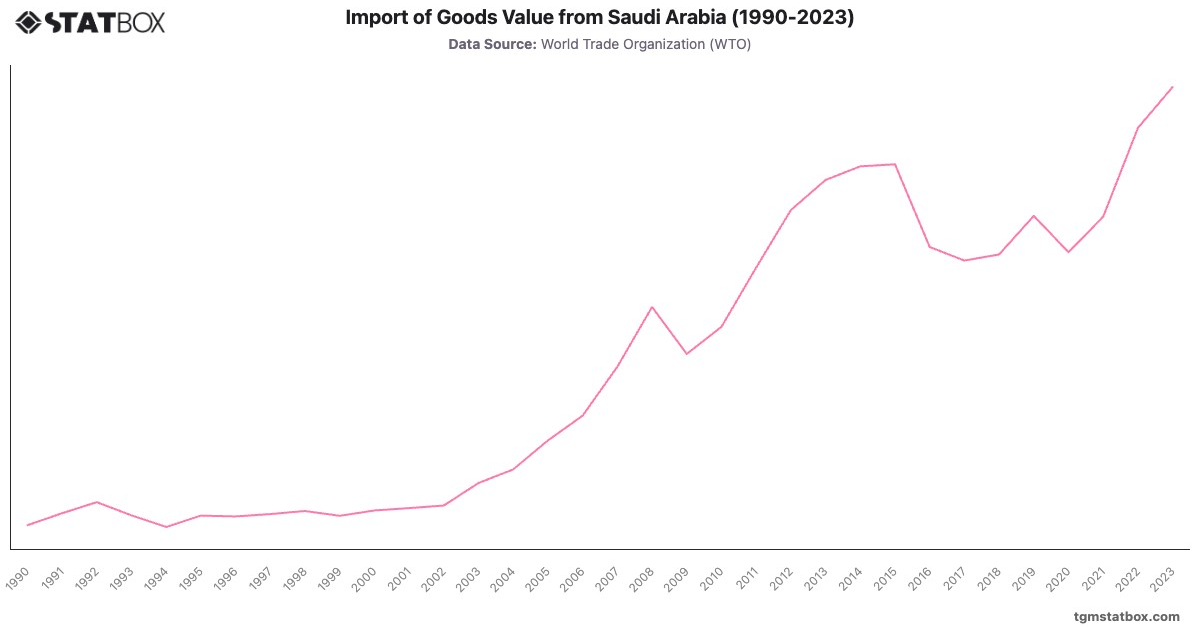
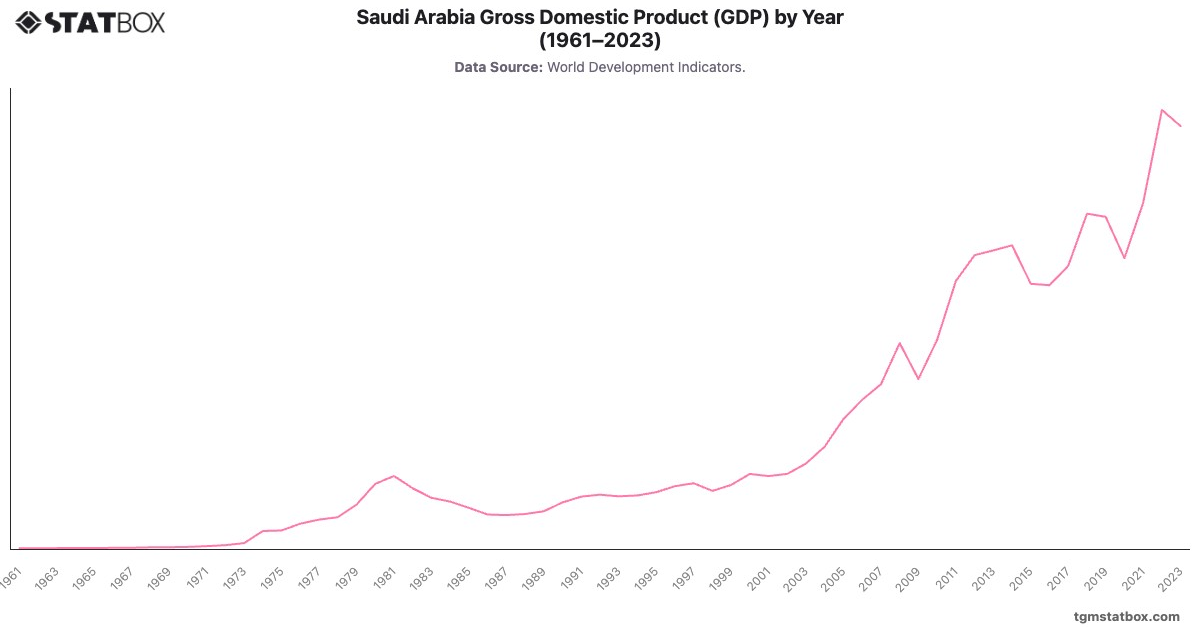
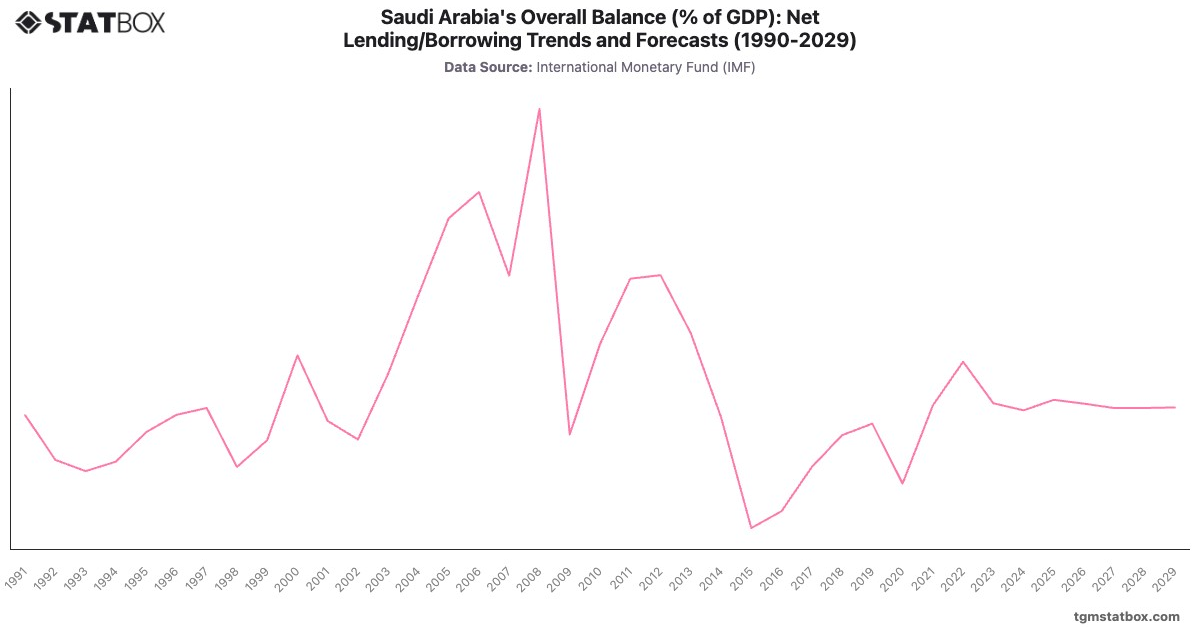
Discover additional trends and data on Saudi Arabia’s annual GDP figures, Saudi Arabia’s net lending/borrowing ratio as a percentage of GDP, Saudi Arabia’s goods trade balance.