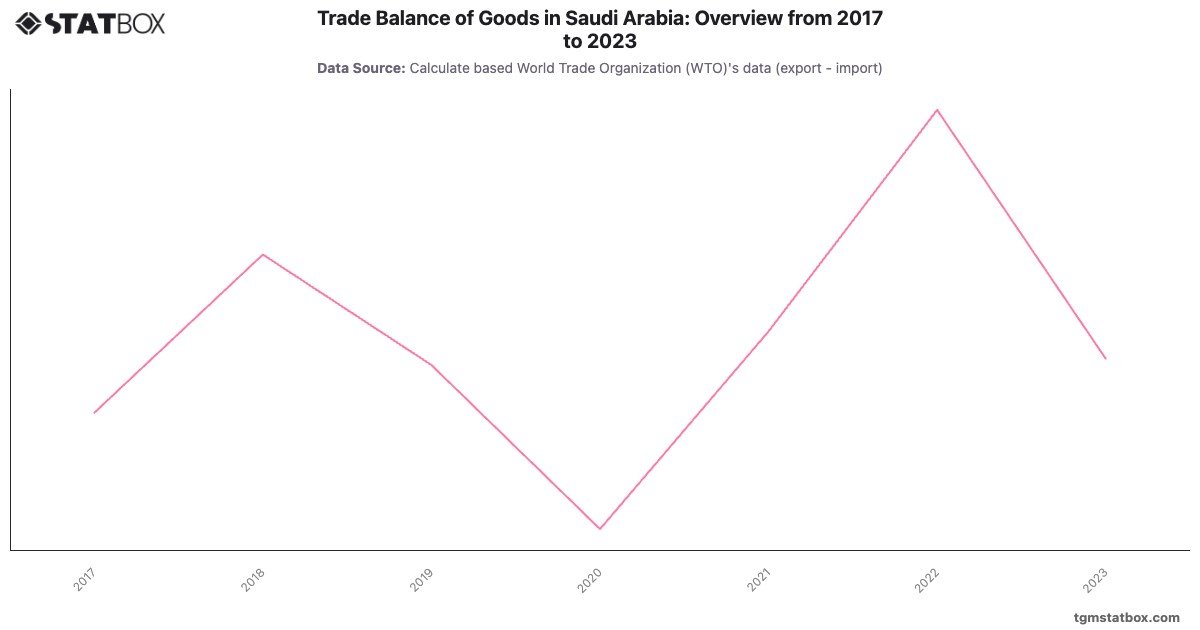
Saudi Arabia consistently posted substantial trade surpluses from 2017 to 2023, driven by its dominant oil exports. The surplus peaked at 221,307.2 million USD in 2022, reflecting high global oil prices and increased production. However, the surplus declined to 111,227.7 million USD in 2023, as oil prices stabilized and production adjusted to global market conditions.
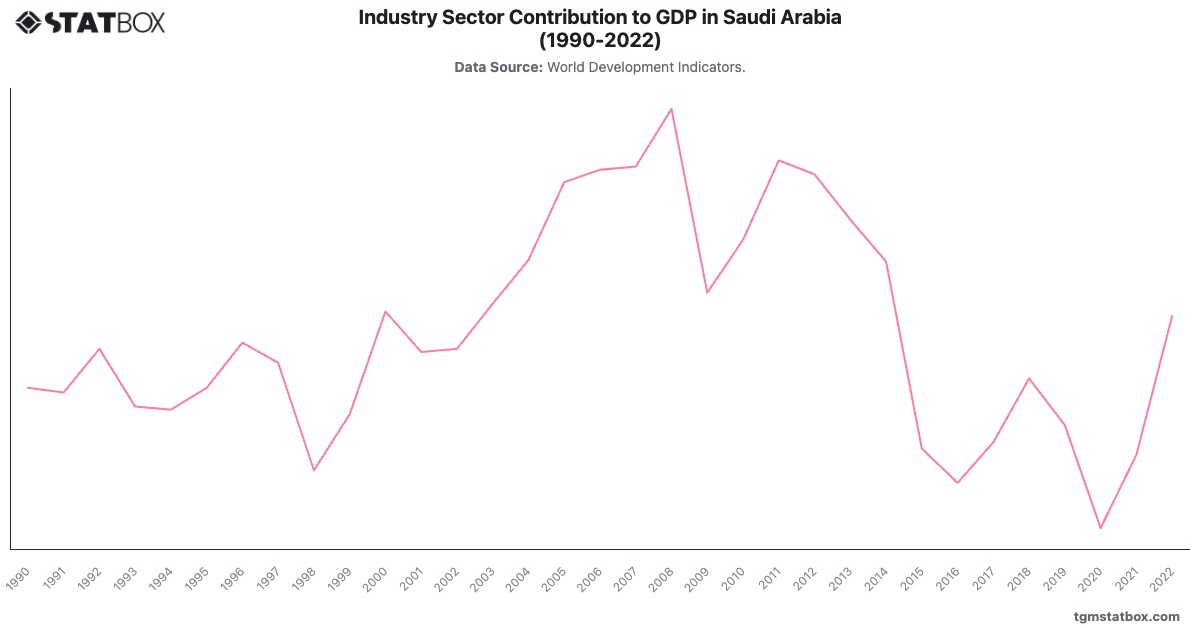
The fluctuations in Saudi Arabia’s trade balance underline its heavy dependence on hydrocarbons, with non-oil exports making limited contributions. Efforts to diversify the economy under Vision 2030 remain critical to reducing the country’s vulnerability to energy market volatility.
The fluctuations in Saudi Arabia’s trade balance underline its heavy dependence on hydrocarbons, with non-oil exports making limited contributions. Efforts to diversify the economy under Vision 2030 remain critical to reducing the country’s vulnerability to energy market volatility.
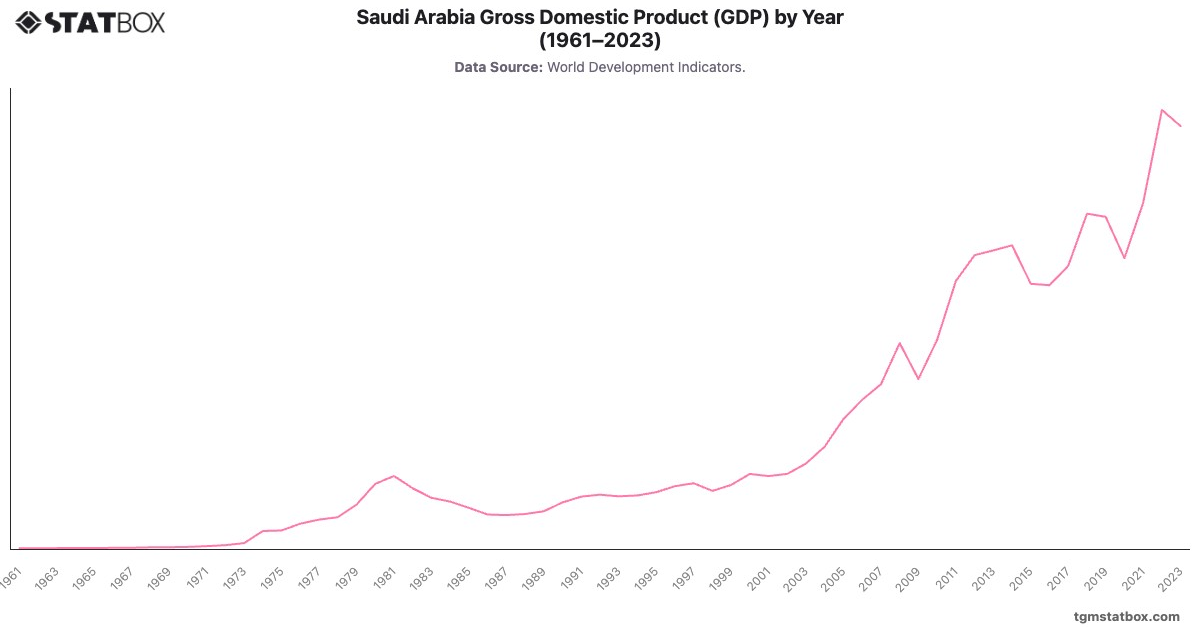
For additional information, visit statistics on Saudi Arabia’s annual GDP growth rate, Saudi Arabia’s annual GDP figures, Saudi Arabia’s industry sector share in GDP.