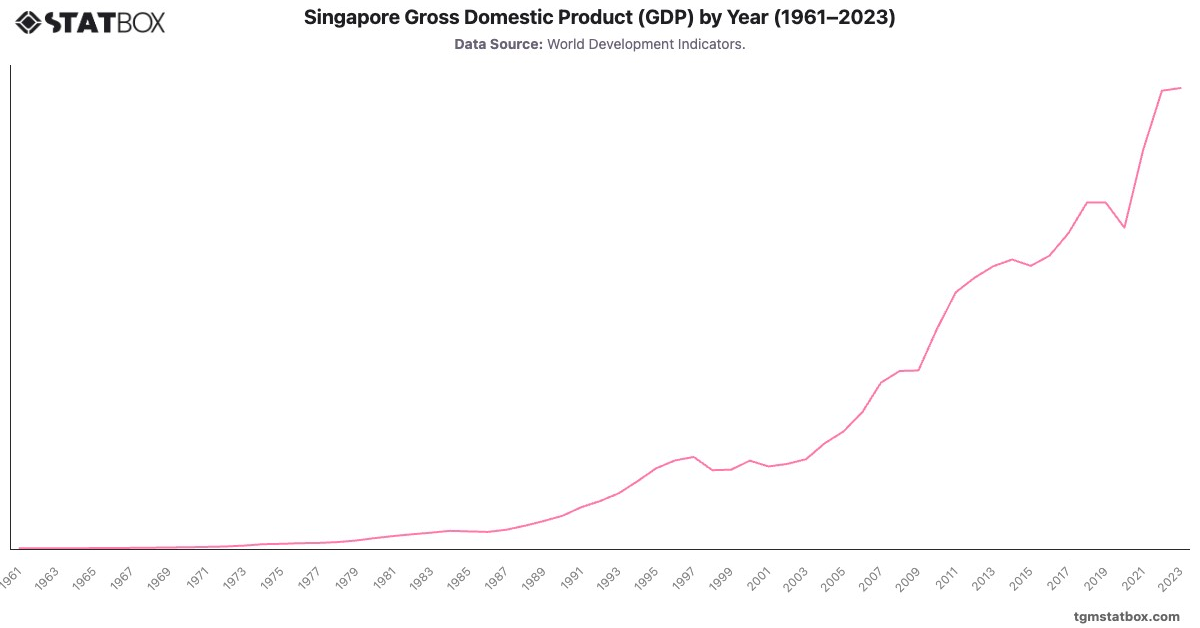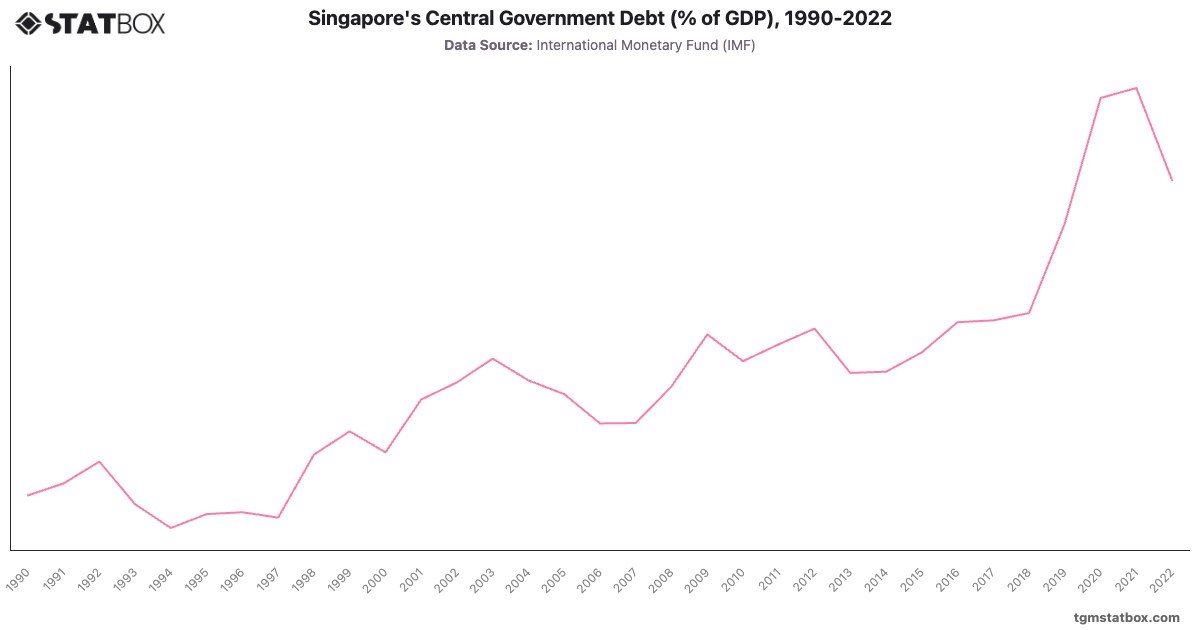
Singapore's central government debt has consistently exceeded of GDP due to the government’s policy of issuing bonds to develop a robust domestic debt market rather than financing deficits. Debt rose steadily from in 1990 to over in the early 2000s, reflecting increased issuance to support infrastructure investments and economic growth.
During the COVID-19 pandemic, debt reached a historic high of in 2021 as Singapore introduced stimulus measures to sustain its economy. By 2022, the ratio moderated to , signaling the recovery of economic activity while maintaining the debt's role in fostering financial stability rather than reflecting fiscal stress.
During the COVID-19 pandemic, debt reached a historic high of in 2021 as Singapore introduced stimulus measures to sustain its economy. By 2022, the ratio moderated to , signaling the recovery of economic activity while maintaining the debt's role in fostering financial stability rather than reflecting fiscal stress.
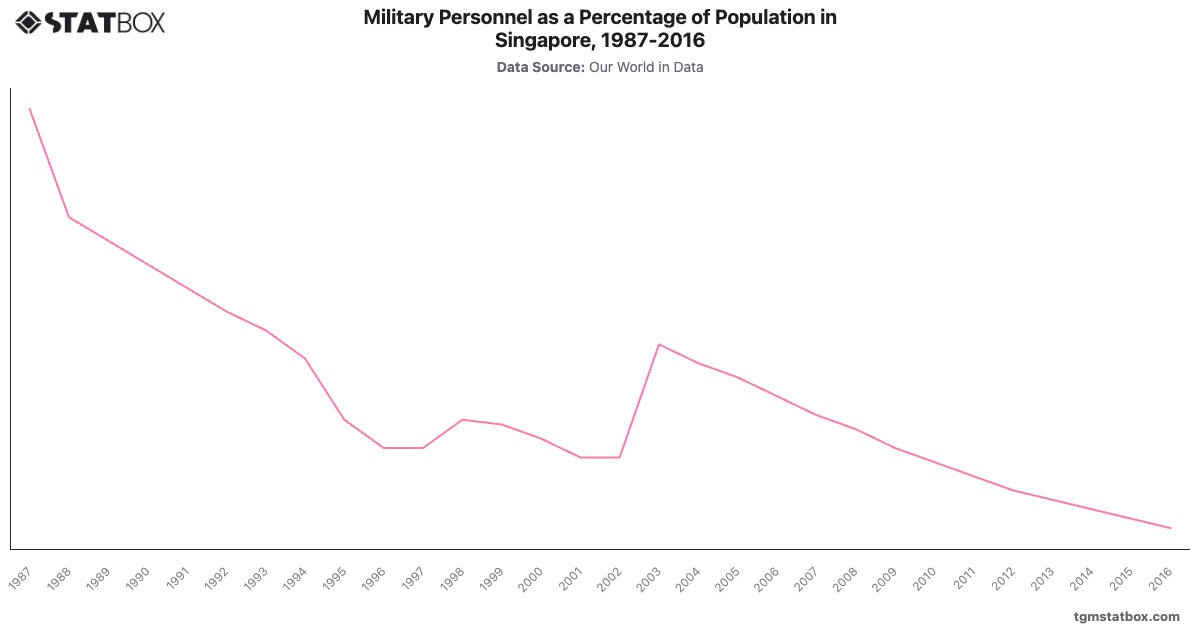
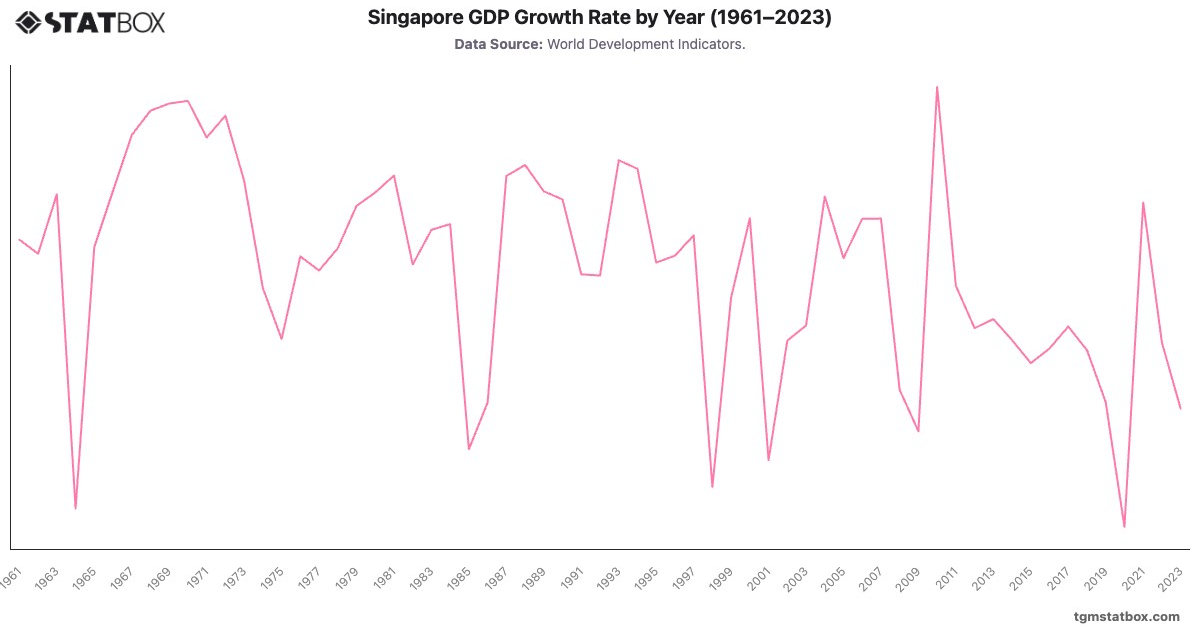
Find out more through related statistics on military personnel proportion in Singapore, Singapore’s annual GDP growth rate, Singapore’s urban expansion.