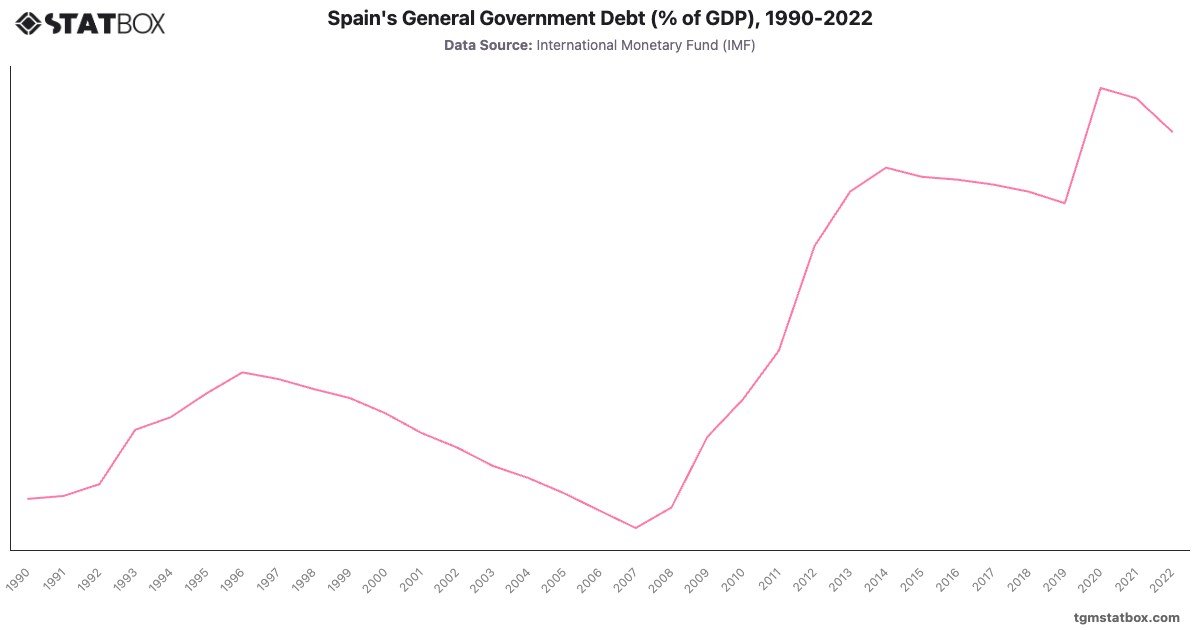
Spain’s government debt trajectory reveals a period of relative stability in the 1990s, with debt-to-GDP ratios hovering around to until 2000, followed by a period of debt reduction spurred by economic growth and fiscal discipline. By 2007, debt fell to , reflecting Spain's economic boom pre-2008. However, the 2008 financial crisis reversed these gains, causing debt to surge as Spain’s economy contracted and unemployment rates soared, necessitating increased public spending to support recovery efforts.
Debt continued to rise sharply in the following years, peaking at in 2020 due to the COVID-19 pandemic, which forced higher public spending on healthcare and economic support measures. The slight decrease to by 2022 suggests a gradual recovery and fiscal adjustment as Spain seeks to stabilize its finances in a post-pandemic economic landscape.
Debt continued to rise sharply in the following years, peaking at in 2020 due to the COVID-19 pandemic, which forced higher public spending on healthcare and economic support measures. The slight decrease to by 2022 suggests a gradual recovery and fiscal adjustment as Spain seeks to stabilize its finances in a post-pandemic economic landscape.
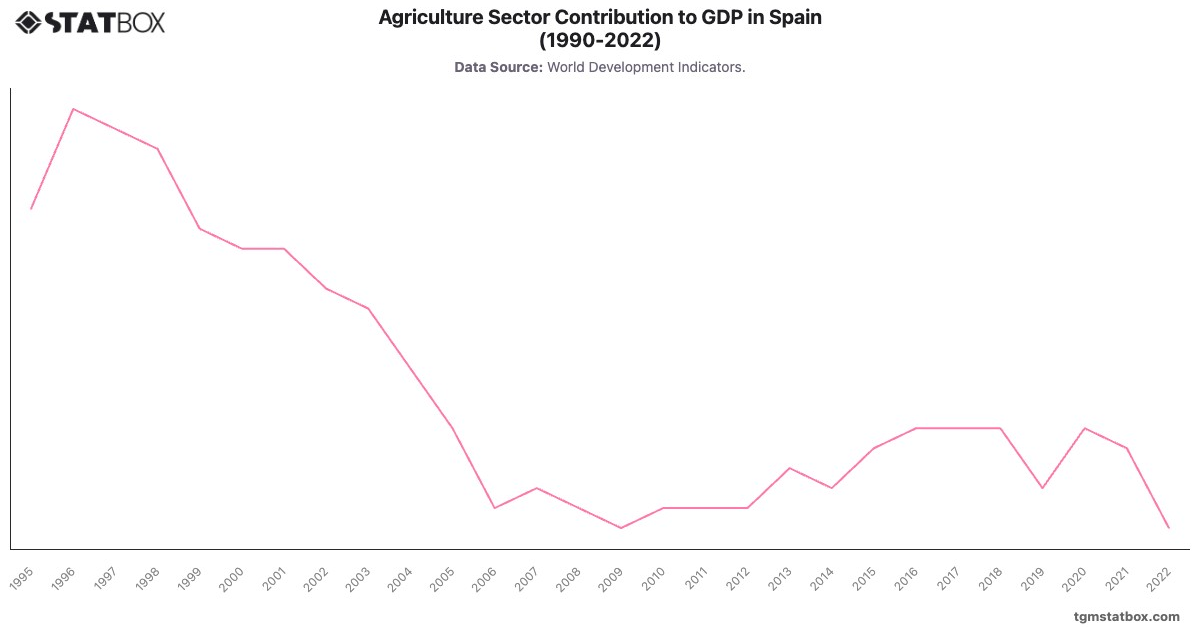
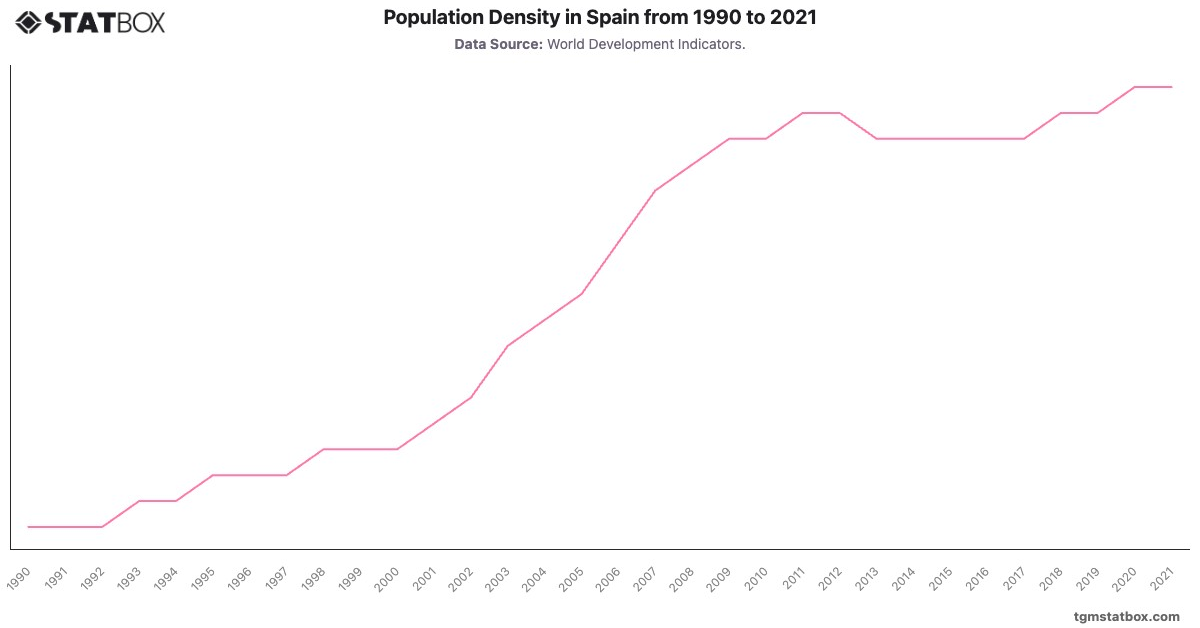
Discover additional trends and data on Spain’s net lending/borrowing balance as a percentage of GDP, Spain’s agricultural sector share in GDP, Spain’s population count.