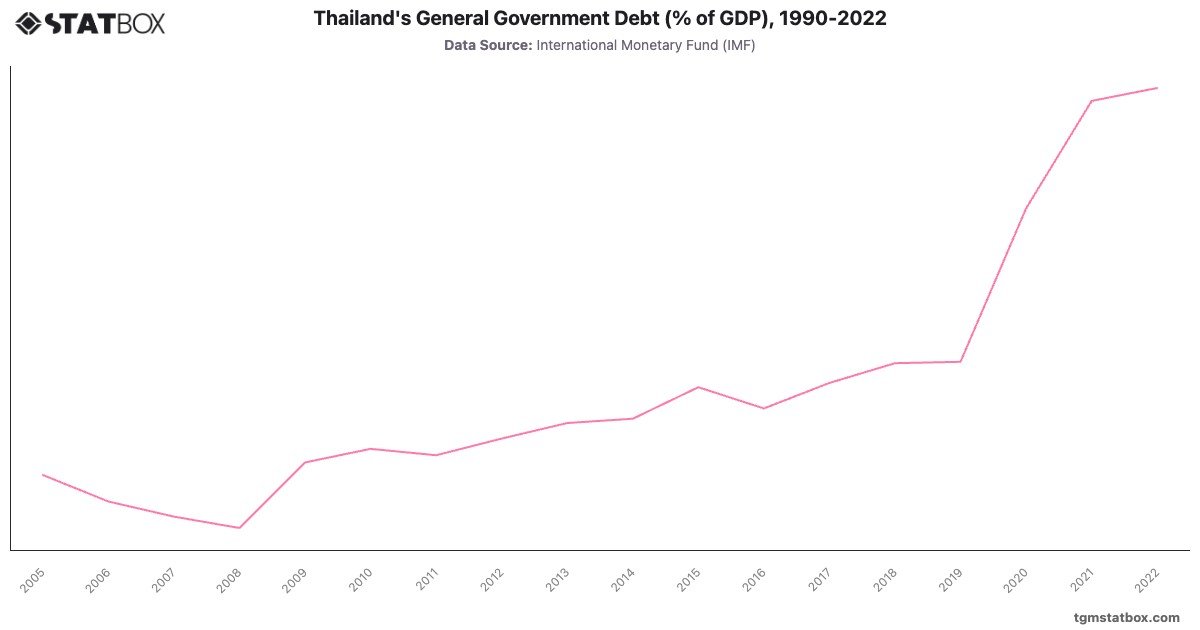
Thailand maintained low debt-to-GDP ratios from 2005, with debt starting at and remaining under through 2019. This period reflects Thailand's conservative fiscal policies and relatively stable economic growth. However, debt levels rose significantly in 2020, reaching as the government increased borrowing to combat the economic impact of the COVID-19 pandemic, supporting healthcare and economic stimulus programs.
Debt continued to rise, peaking at in 2022. The increase highlights Thailand's fiscal response to sustain its economy through global uncertainties, though it remains within manageable levels. This shift underscores Thailand’s commitment to economic support despite historically conservative fiscal policies.
Debt continued to rise, peaking at in 2022. The increase highlights Thailand's fiscal response to sustain its economy through global uncertainties, though it remains within manageable levels. This shift underscores Thailand’s commitment to economic support despite historically conservative fiscal policies.
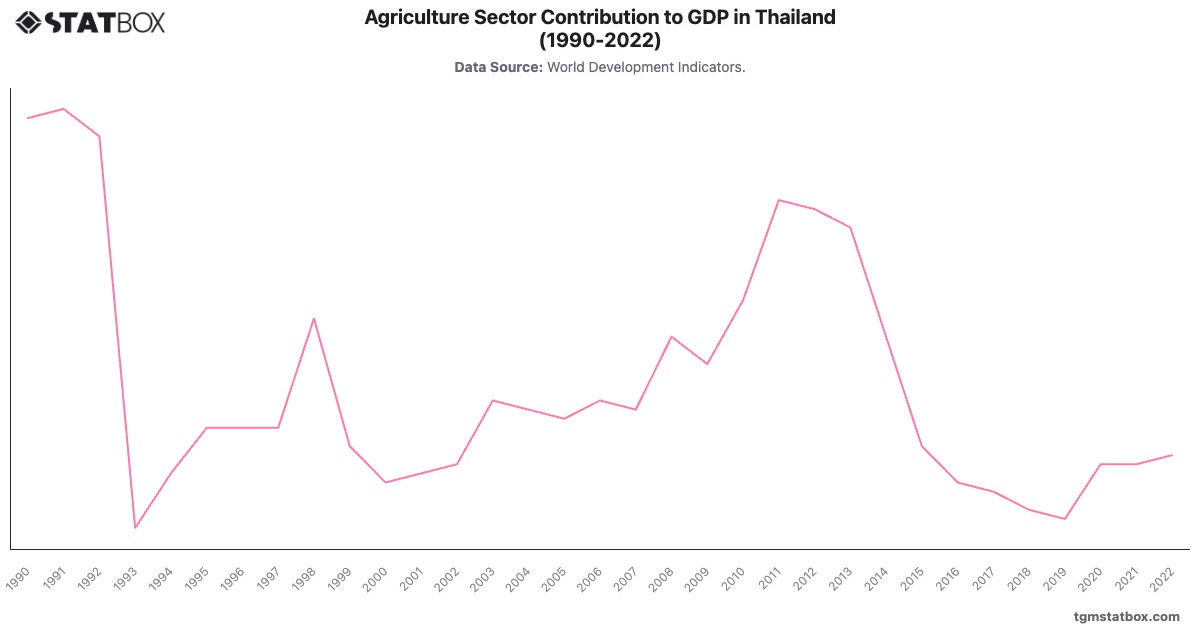
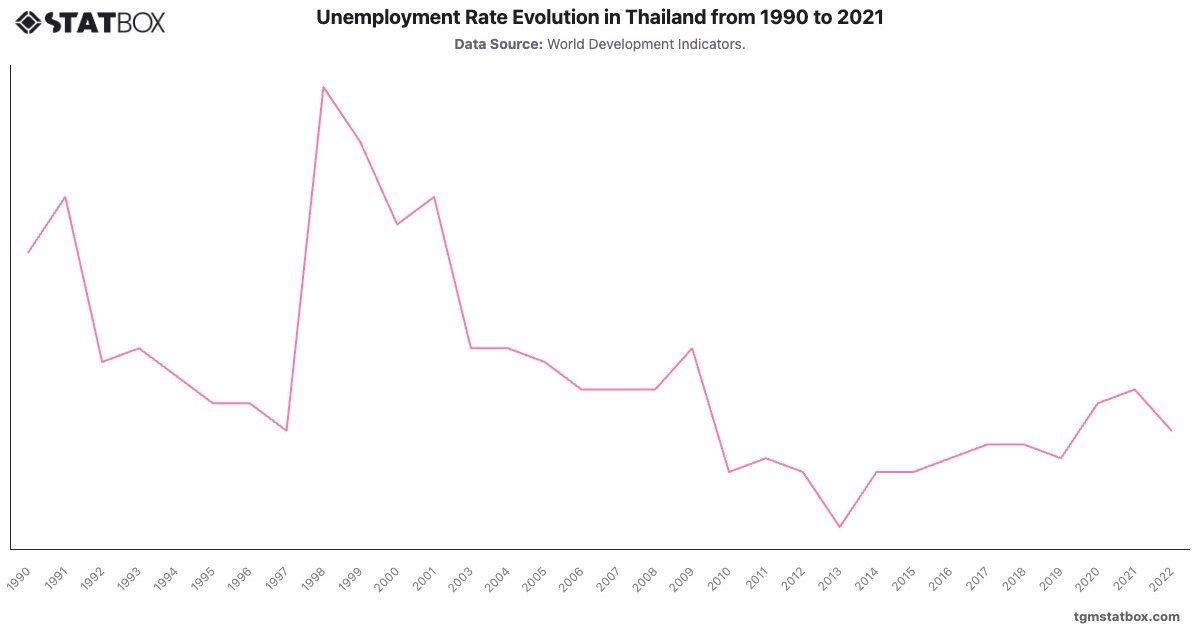
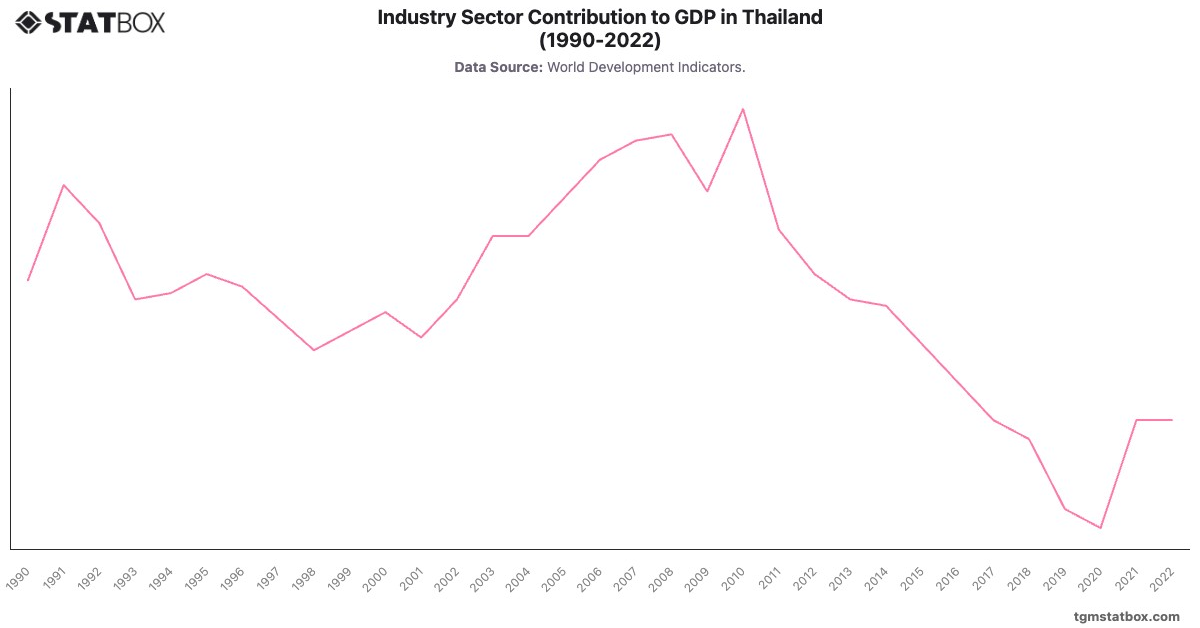
For additional information, visit statistics on Thailand’s agriculture share in GDP, Thailand’s industry sector share, Thailand’s unemployment rate.