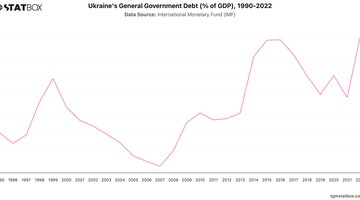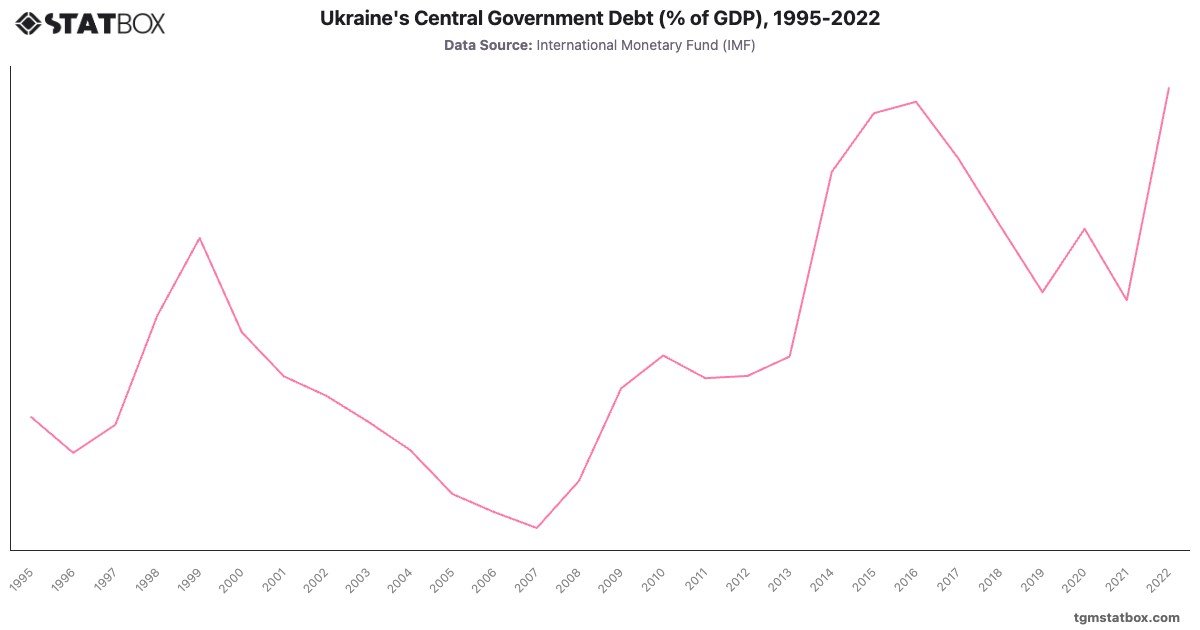
Ukraine’s central government debt rose significantly during the late 1990s, peaking at in 1999 due to economic restructuring and financial instability following independence. By 2007, debt had declined to , supported by robust growth and debt restructuring efforts. However, the 2014 conflict in Eastern Ukraine and economic downturn led to a surge, peaking at in 2016.
Despite some recovery, the 2022 Russian invasion saw debt skyrocket to , reflecting the severe economic strain and increased borrowing needs to support defense and recovery efforts.
Despite some recovery, the 2022 Russian invasion saw debt skyrocket to , reflecting the severe economic strain and increased borrowing needs to support defense and recovery efforts.
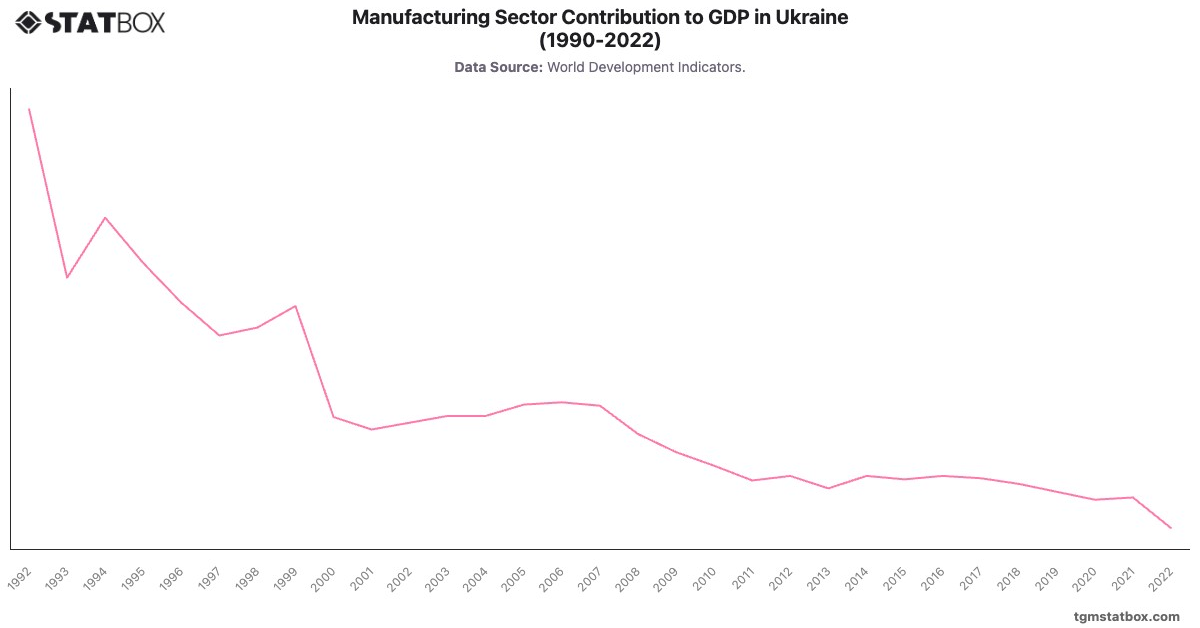
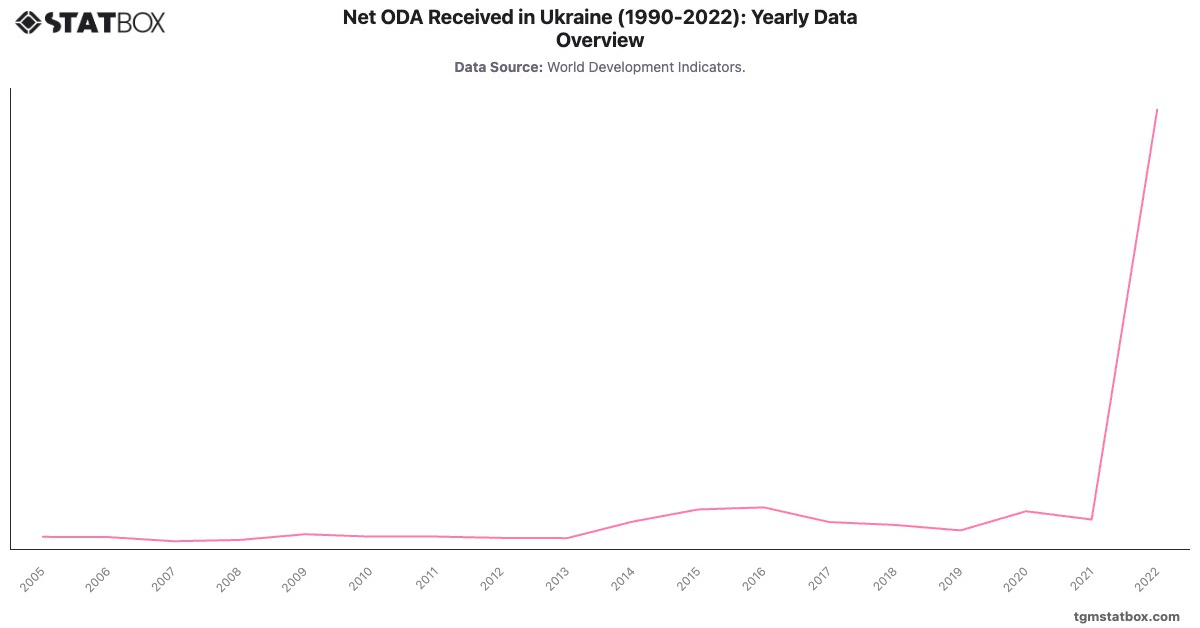
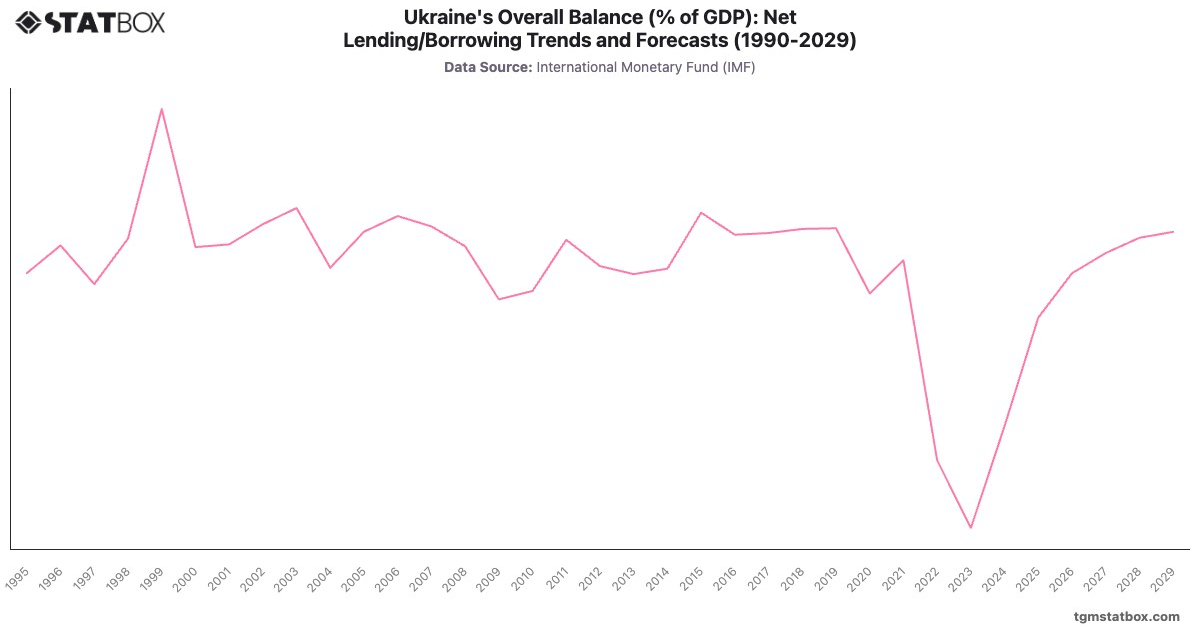
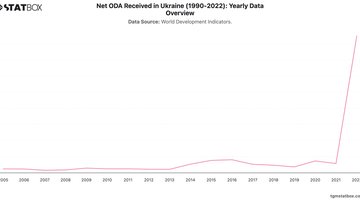
For additional information, visit statistics on Ukraine’s net lending/borrowing as a percentage of GDP, Industry sector’s share in Ukraine’s GDP, overview of Ukraine’s net ODA received.