Insights library
Not sure where to start? Dive into a diverse selection of charts and data visualizations across topics, and find the information you need to drive your research and analysis.
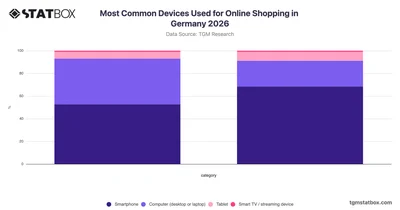

Explore the most used devices for online shopping in Germany by gender in 2026, including differences in smartphone usage between men and women on TGM StatBox.
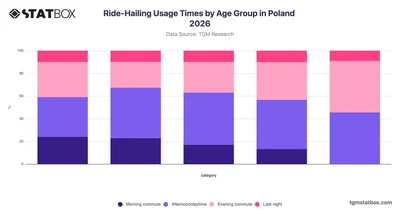
Explore how ride-hailing usage times vary across age groups in Poland with TGM StatBox's 2026 breakdown of morning, daytime, evening, and late-night travel patterns.
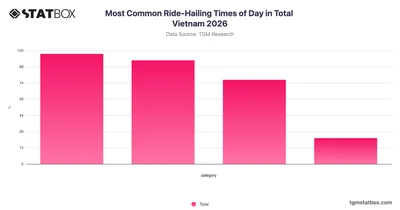
Explore when Vietnamese riders most commonly use ride-hailing services throughout the day with this 2026 Vietnam data from TGM StatBox.
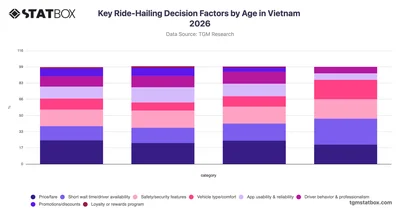
Explore how ride-hailing decision factors vary by age group in Vietnam with TGM StatBox, revealing generational differences in priorities like price, safety, and wait times.
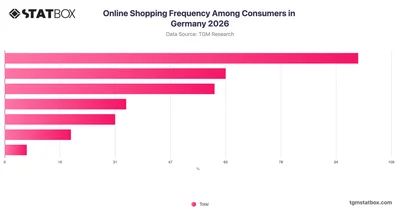
Explore how often German consumers shop online in 2026 with TGM StatBox, revealing that most shop multiple times a month while weekly shoppers form a strong share.
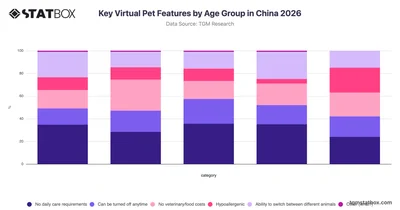
Compare key virtual pet features preferred across age groups in China with TGM StatBox data covering daily care, costs, and customization options.
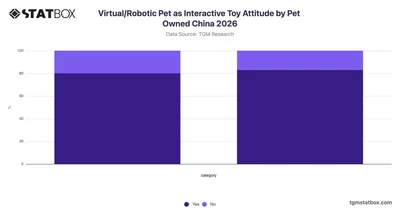
Explore attitudes toward virtual and robotic pets as interactive toys among cat and dog owners in China with TGM StatBox's 2026 survey data.
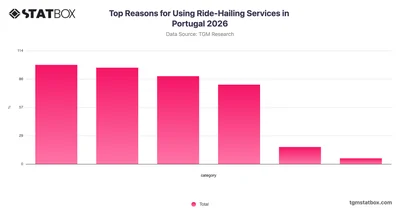
Explore why people in Portugal use ride-hailing services in 2026 with TGM StatBox, covering key reasons from daily commutes to social activities and emergencies.
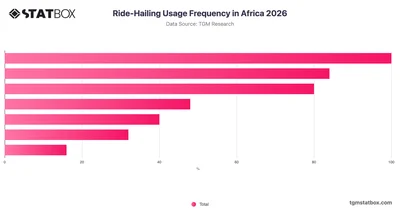
Explore ride-hailing usage frequency across Africa in 2026 with TGM StatBox, covering how often consumers use these services throughout the region.
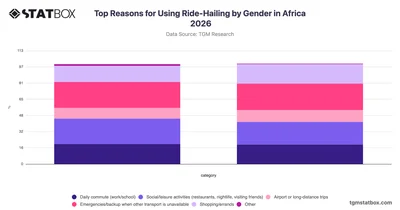
Explore why people use ride-hailing services in Africa by gender in 2026 with TGM StatBox, covering commuting, leisure, emergencies, and more.
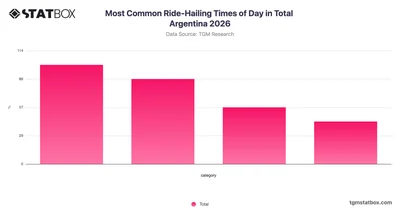
Explore how ride-hailing usage is distributed across different times of day in Argentina with this TGM StatBox chart covering 2026 data.
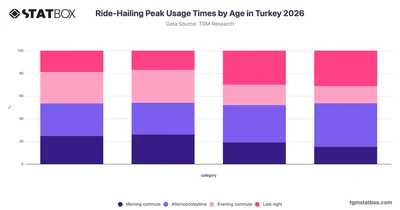
Discover how ride-hailing peak usage times vary across age groups in Turkey with this TGM StatBox chart covering morning, daytime, evening, and late-night patterns.
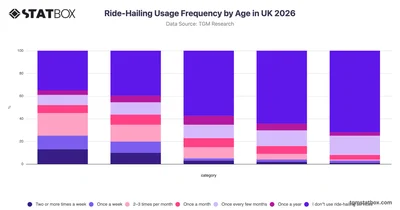
Discover how ride-hailing usage frequency varies across age groups in the UK with this TGM StatBox chart covering adults from 18 to 75.
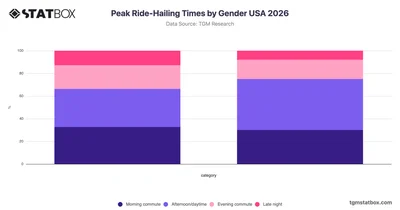
Explore peak ride-hailing usage times by gender in the USA with TGM StatBox, revealing how men and women differ in when they choose to book rides.
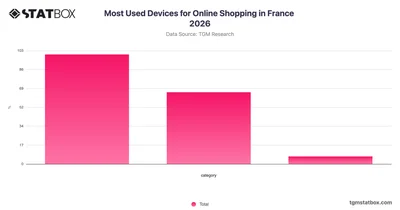
Explore France's most used devices for online shopping in 2026 on TGM StatBox — smartphones lead at 58%, far ahead of computers at 38%.
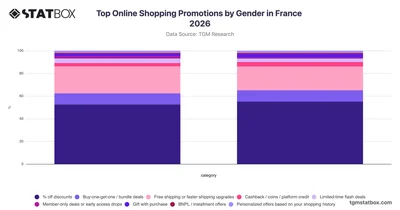
Explore TGM StatBox data on France's top online shopping promotions in 2026, where % off discounts lead for both genders and free shipping ranks a strong second.
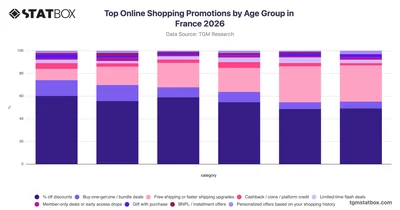
Explore TGM StatBox data on France's top online shopping promotions by age group in 2026, where % off discounts lead across all ages and free shipping dominates among older shoppers.
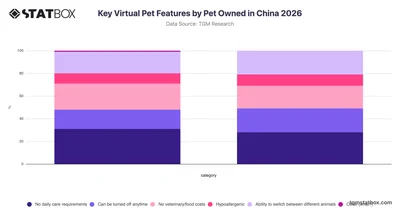
Explore how cat and dog owners in China prioritize virtual pet features with this TGM StatBox chart covering key appeal factors for 2026.
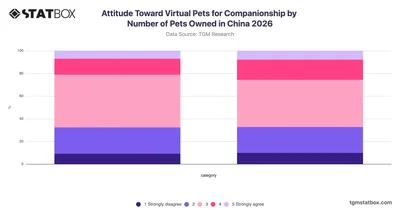
Compare attitudes toward virtual pets for companionship among pet owners in China, broken down by number of pets owned, with TGM StatBox survey data from 2026.
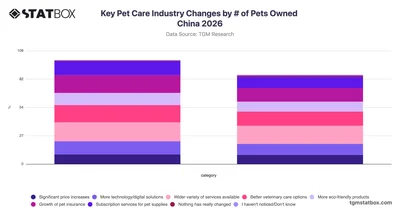
Compare how multi-pet and single-pet owners in China perceive key pet care industry changes in 2026 with TGM StatBox data.
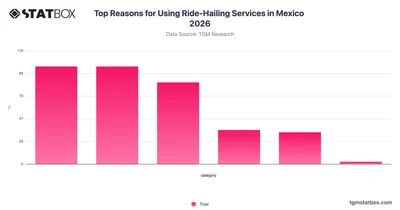
Explore why people in Mexico use ride-hailing services, from daily commutes to emergencies, with TGM StatBox data for 2026.
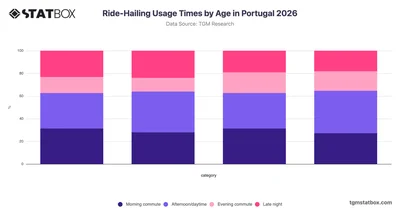
Explore how ride-hailing usage times vary across age groups in Portugal with this TGM StatBox chart covering morning, daytime, evening, and late-night travel patterns.
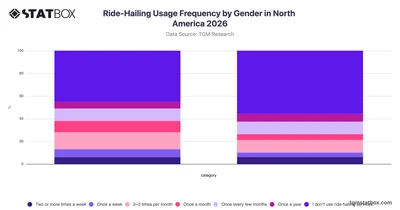
Explore ride-hailing usage frequency by gender in North America with TGM StatBox, covering how often men and women use these services in 2026.
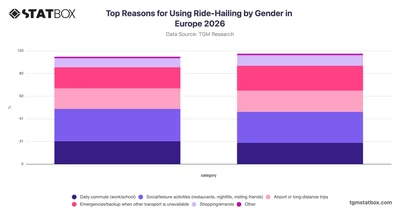
Compare how men and women in Europe use ride-hailing services across key use cases with TGM StatBox's 2026 gender-segmented data.
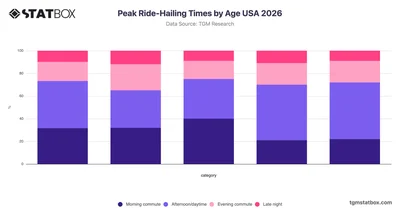
Explore peak ride-hailing usage times across US age groups in 2026 with TGM StatBox, revealing how preferences shift by generation.
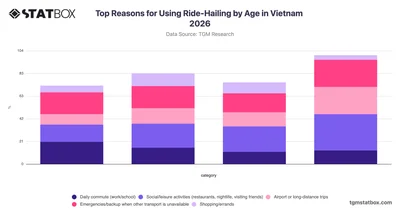
Explore how ride-hailing usage motivations vary across age groups in Vietnam with this TGM StatBox chart covering commuting, leisure, and more.
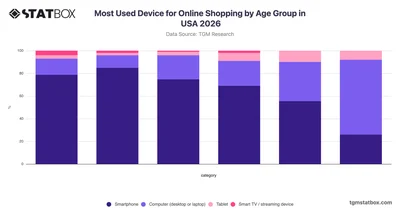
TGM StatBox reveals how Americans shop online by device in 2026, with younger adults overwhelmingly preferring smartphones while older groups lean toward computers.
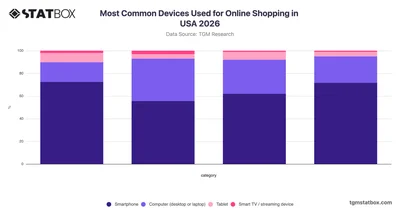
Explore TGM StatBox data on the most common devices used for online shopping in USA 2026, where smartphones dominate across all user groups while computers rank second.
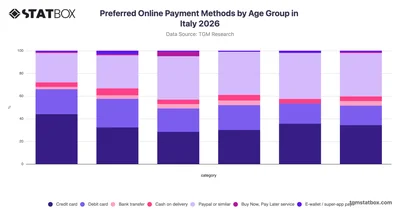
Explore TGM StatBox data on preferred online payment methods in Italy 2026, where PayPal dominates among older adults while credit cards lead with younger shoppers.
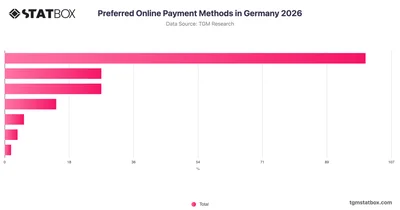
Explore Germany's preferred online payment methods in 2026 with TGM StatBox, where PayPal dominates and credit cards and bank transfers tie for second place.






