Insights library
Not sure where to start? Dive into a diverse selection of charts and data visualizations across topics, and find the information you need to drive your research and analysis.
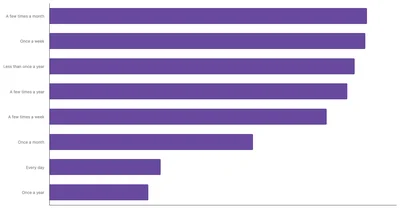

While a small percentage (5.8%) gamble every day, the majority of Australians engage in this activity less regularly. About 14.4% gamble a few times a week.
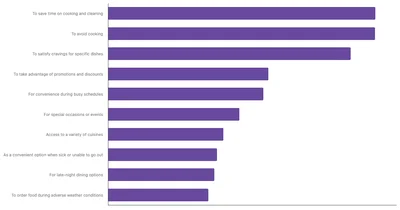
The main reasons people use food delivery apps are practical—avoiding cooking and saving time—along with satisfying cravings (30.3%) and accessing promotions.
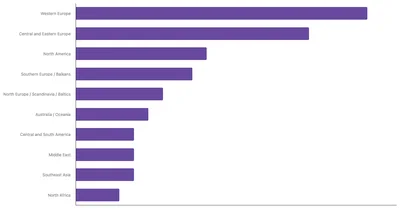
Western and Central Europe lead 2025 UK flight plans, as British travelers favor nearby, budget-friendly destinations post-Brexit. Full data on TGM StatBox.
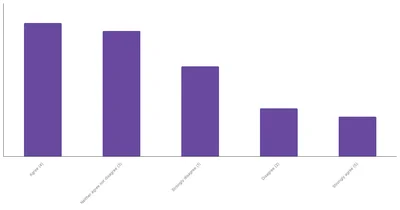
Sports Interest Through Betting in New Zealand | TGM Statbox Chart: Analyze how New Zealanders' sports interest connects with betting via TGM Statbox's chart.
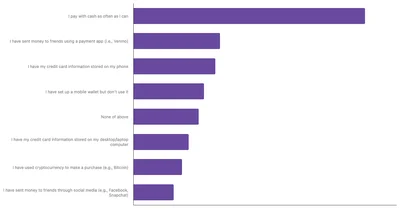
In Colombia, paying with cash is still the most common choice, more than half of people prefer it whenever they can. That said, digital payments are starting to pick up.
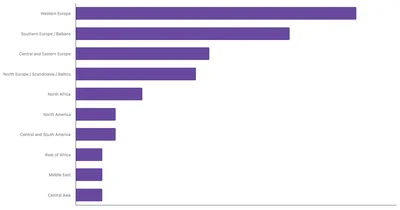
Polish travelers in 2025 shift toward Western Europe, while Southern Europe and Balkans remain favorites for culture, food, and warm getaways.
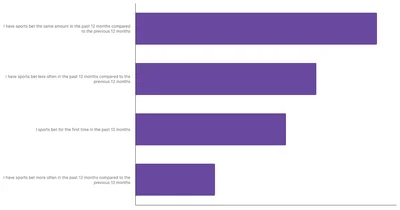
Track changes in betting habits among Swiss, highlighting shifts in preferences and activities over time with this TGM Statbox chart.
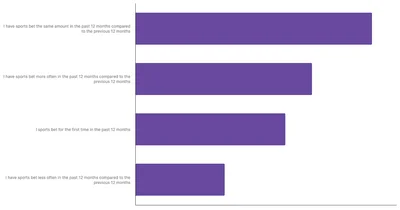
Changes in Betting Habits of Peruvians | TGM Statbox Chart: Learn about the changing betting habits of Peruvians with TGM Statbox's comprehensive chart.
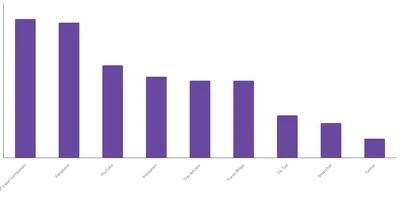
In Mexico, websites of travel companies are the most commonly used source for discovering new destinations, with 36% of respondents relying on them.
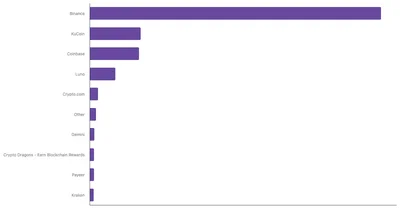
In Nigeria, Binance clearly dominates as the most popular cryptocurrency exchange, used by over 70% of crypto traders. KuCoin and Coinbase follow but with much smaller shares.
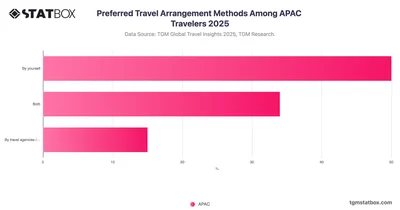
50% of APAC travelers plan trips independently, while 34% use a hybrid model—reflecting regional diversity and a growing preference for customized yet convenient travel planning.
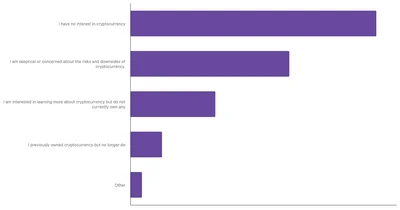
50.8% of Dutch respondents have no interest in cryptocurrency, while a sizable group expresses skepticism, citing concerns over volatility, regulation, and security.
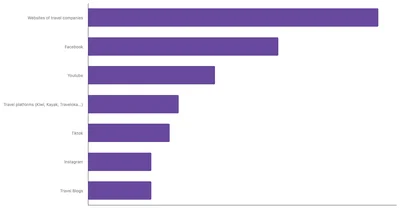
British tourists rely on travel websites and Facebook for trip ideas in 2025, favoring practical, trusted sources over viral content. Full data on TGM StatBox.
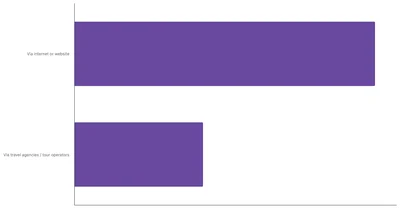
In 2025, most Brazilian travelers (70%) book their trips online through websites, while 30% still rely on travel agencies or tour operators.
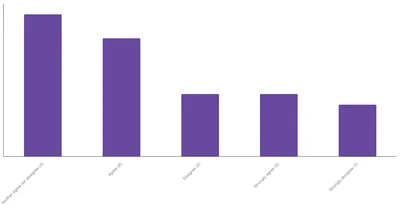
In Belgium, 41% enjoy sports betting content, while 26% show disinterest, reflecting mixed feelings about betting discussions on social media or websites.
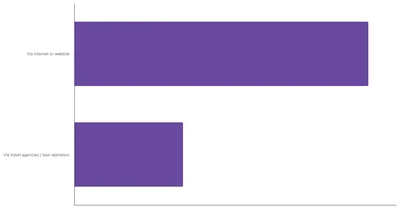
In 2025, most German travelers prefer to book their trips online, with 73% using websites and digital platforms. Travel agencies still play a role for 27% of travelers.
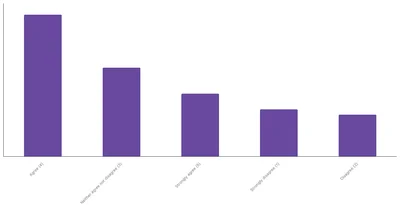
Explore how engaged Britons are with sports betting content, from media consumption to online engagement, through this TGM Statbox chart.
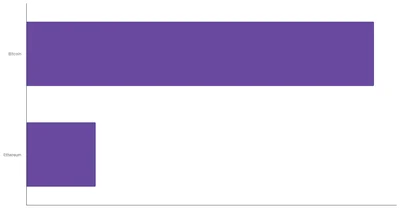
In Chile, Bitcoin is by far the most commonly traded cryptocurrency on exchanges, with 19.72% of survey respondents indicating it as their top choice.
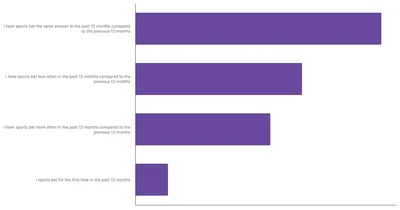
Changes in Betting Habits of Portuguese | TGM Statbox Chart: Learn about the changing betting habits of Portuguese with TGM Statbox's comprehensive chart.
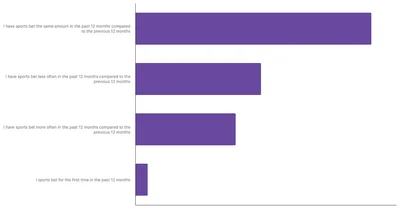
In Italy, sports betting habits are a mixed bag. While nearly half of bettors (49.7%) are sticking to their usual routine, about 21% are betting more frequently.
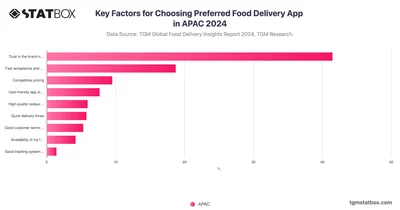
In the competitive food delivery market across APAC, brand trust clearly leads the way, with 41.47% of users citing it as the primary reason for choosing their go-to app.
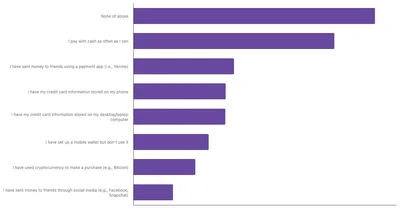
While digital payment methods are growing in popularity in Belgium, there is still a notable attachment to traditional methods like cash (29%).
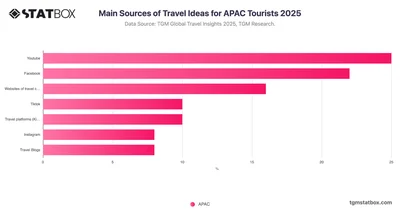
YouTube and Facebook drive travel inspiration in APAC, while travel websites and booking platforms see strong engagement, showing a blend of peer and branded influence.
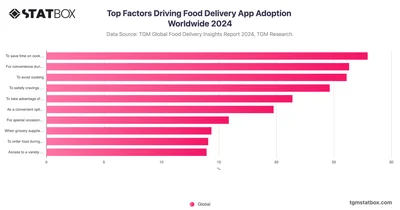
The top reasons global users use food delivery apps include saving time on cooking and cleaning (27.94%) and convenience during busy schedules.
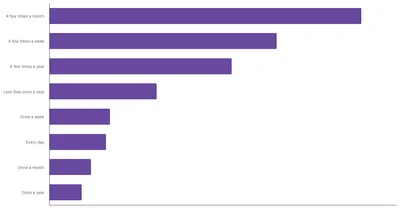
About 30.56% of Colombians gamble a few times a month, while 22.26% bet weekly, showing regular gambling is common alongside notable occasional participation.
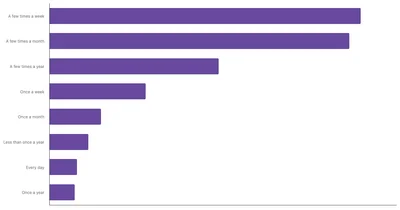
Casino Gambling Frequency Among Peruvians | TGM Statbox Chart: Explore the frequency of casino gambling among Peruvians with TGM Statbox's detailed chart.
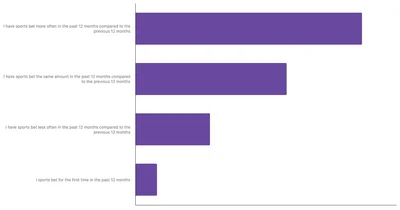
In Brazil, 47.72% of sports bettors have increased their betting frequency in the past year, indicating a rising trend in sports betting engagement.
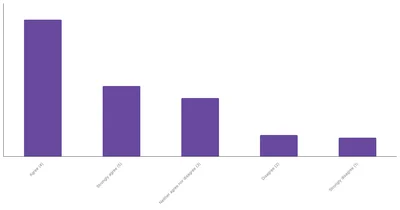
Understand how sports interest is influenced by betting activities in Spain, with detailed data on sports preferences and betting behaviors.
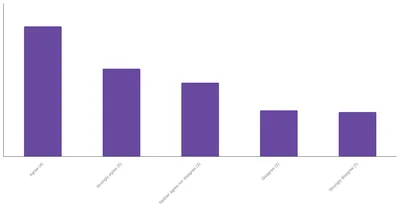
About 57% of French respondents enjoy sports betting content, but 24% do not, showing mixed interest and opportunities for platforms to enhance engagement.
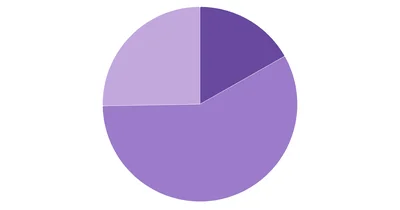
With nearly 58% of the population unfamiliar with cryptocurrency, there is a clear challenge in increasing understanding of digital currencies.






