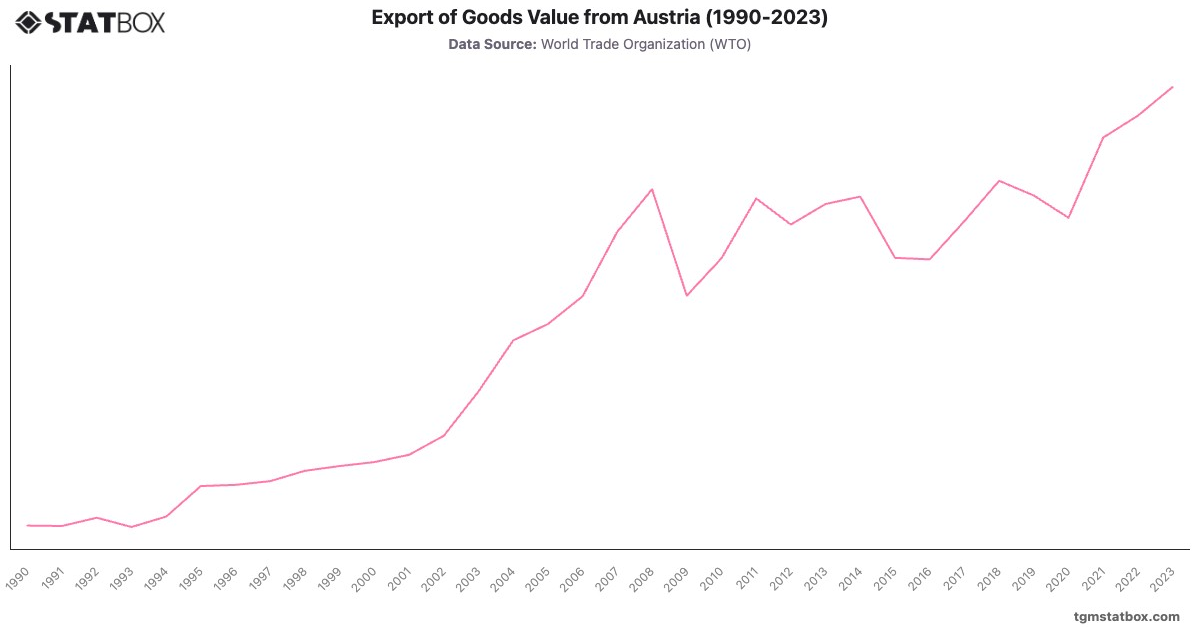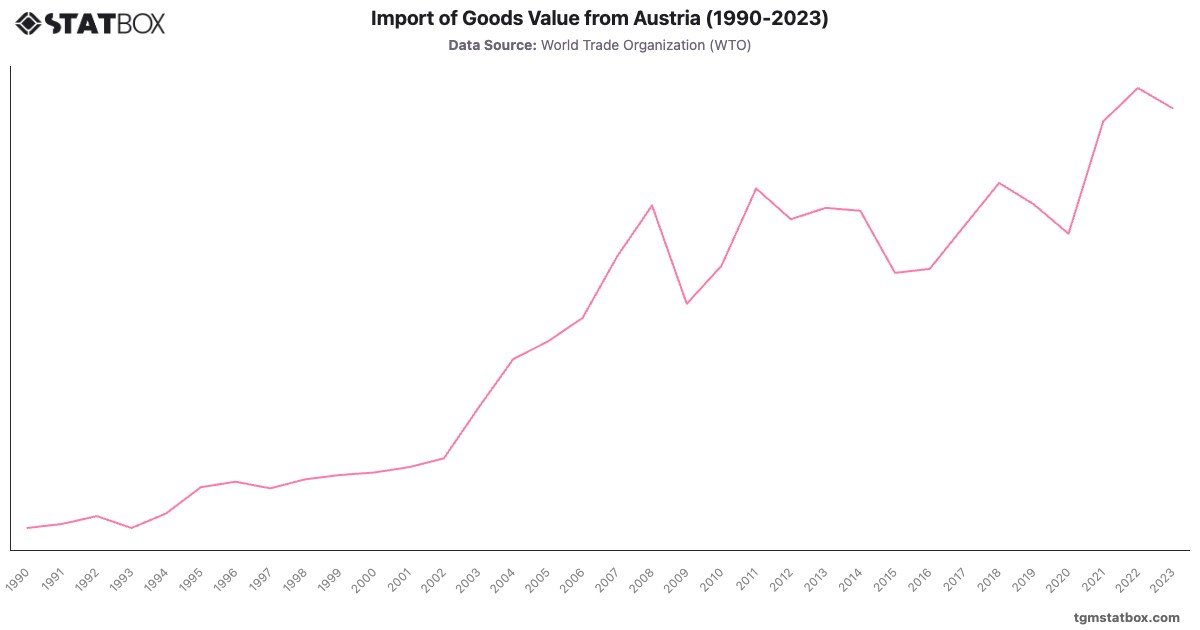
Austria's imports grew steadily from $49.1B in 1990 to $119.9B in 2004, driven by EU integration and its strategic location in Central Europe. The 2008 peak of $184.3B reflected robust trade relations within the EU and beyond. However, the global financial crisis caused a contraction to $143B in 2009.
From 2010 onward, imports rebounded, reaching $233.5B in 2022, supported by Austria's advanced manufacturing and export-oriented economy. The slight decrease to $225B in 2023 highlights challenges like energy price shocks and global supply chain disruptions. Austria's consistent import growth underscores its stable economy and strong EU trade integration.
From 2010 onward, imports rebounded, reaching $233.5B in 2022, supported by Austria's advanced manufacturing and export-oriented economy. The slight decrease to $225B in 2023 highlights challenges like energy price shocks and global supply chain disruptions. Austria's consistent import growth underscores its stable economy and strong EU trade integration.
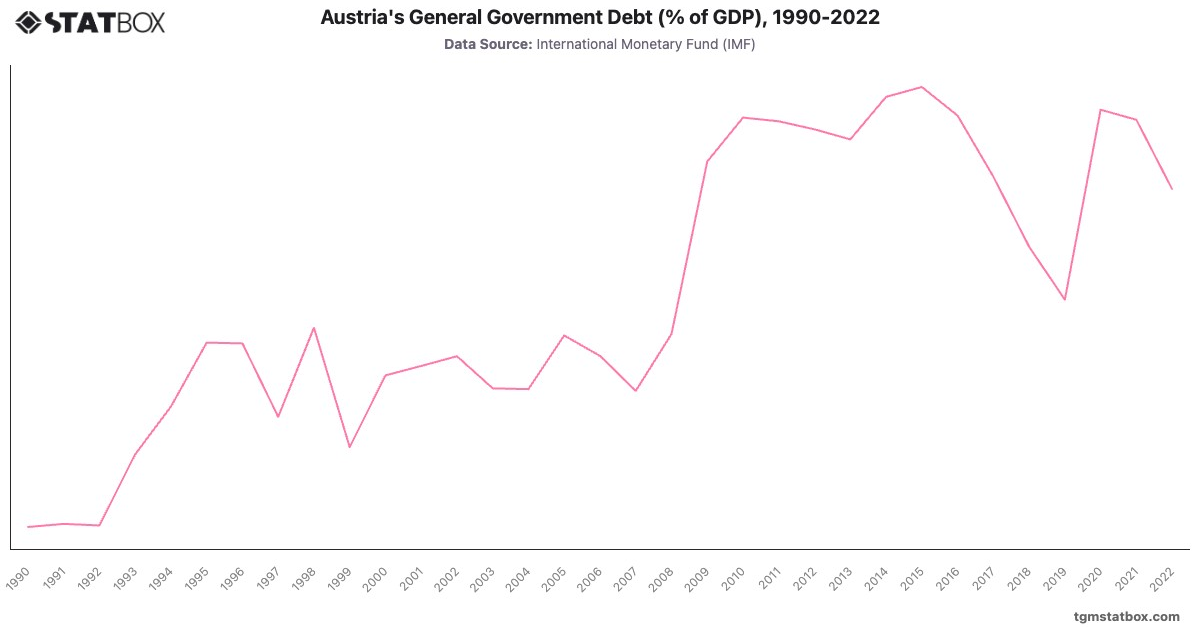
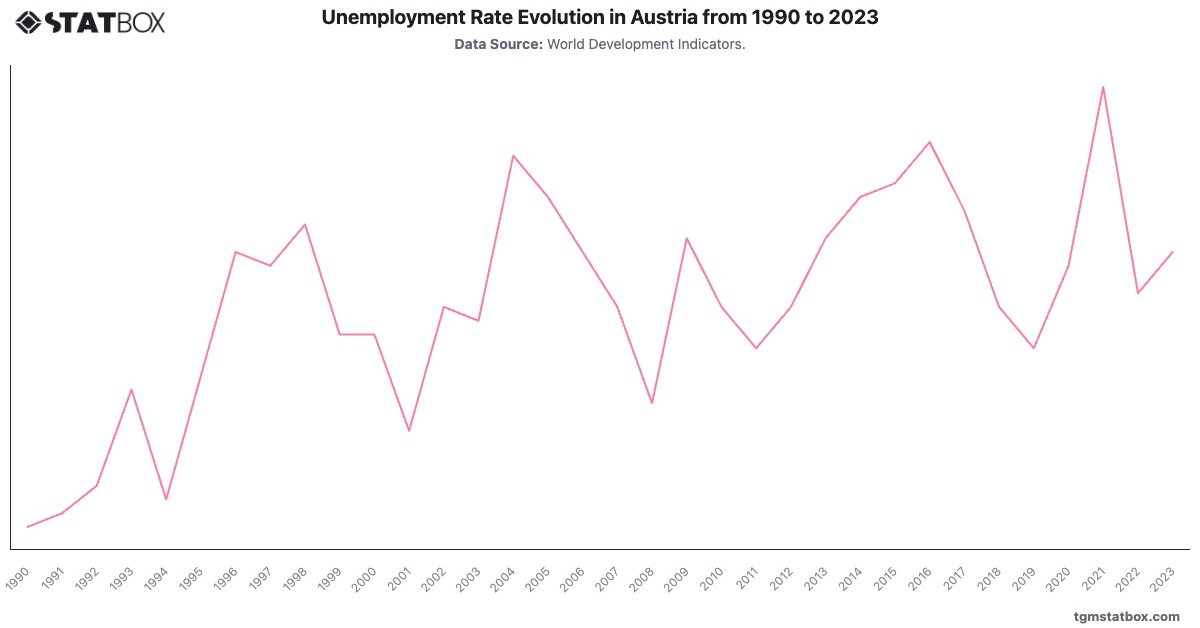
For a broader context, visit other statistics on Austria’s unemployment rate trend, Austria’s population figures, Austria’s government debt-to-GDP ratio.