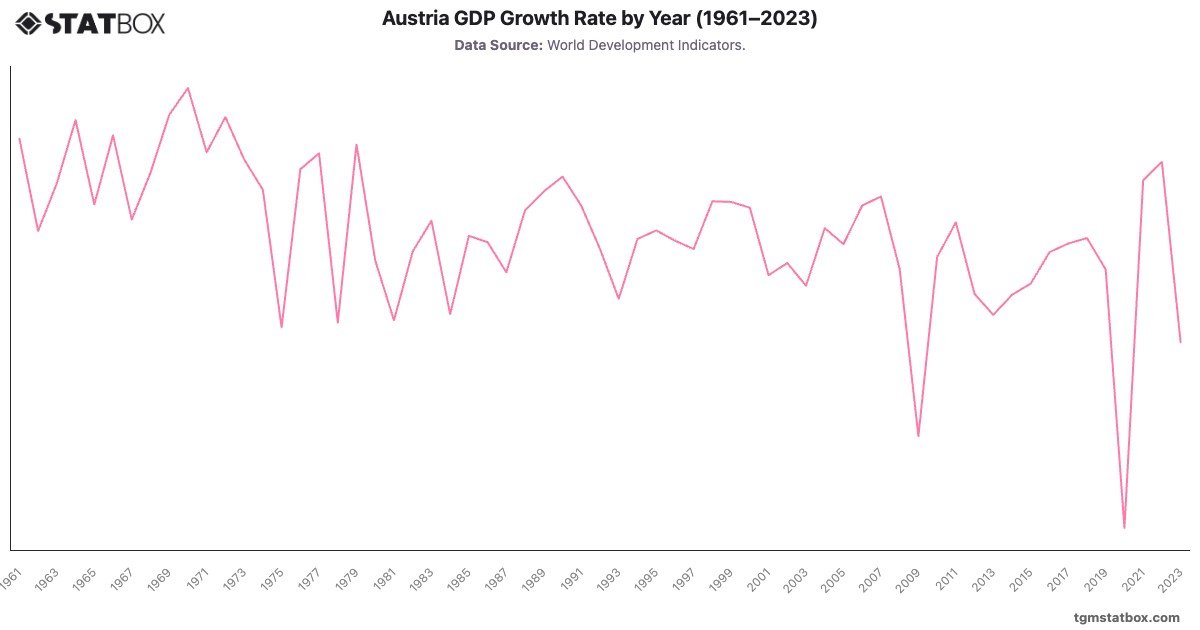
Austria GDP Growth Rate by Year (1961-2023)
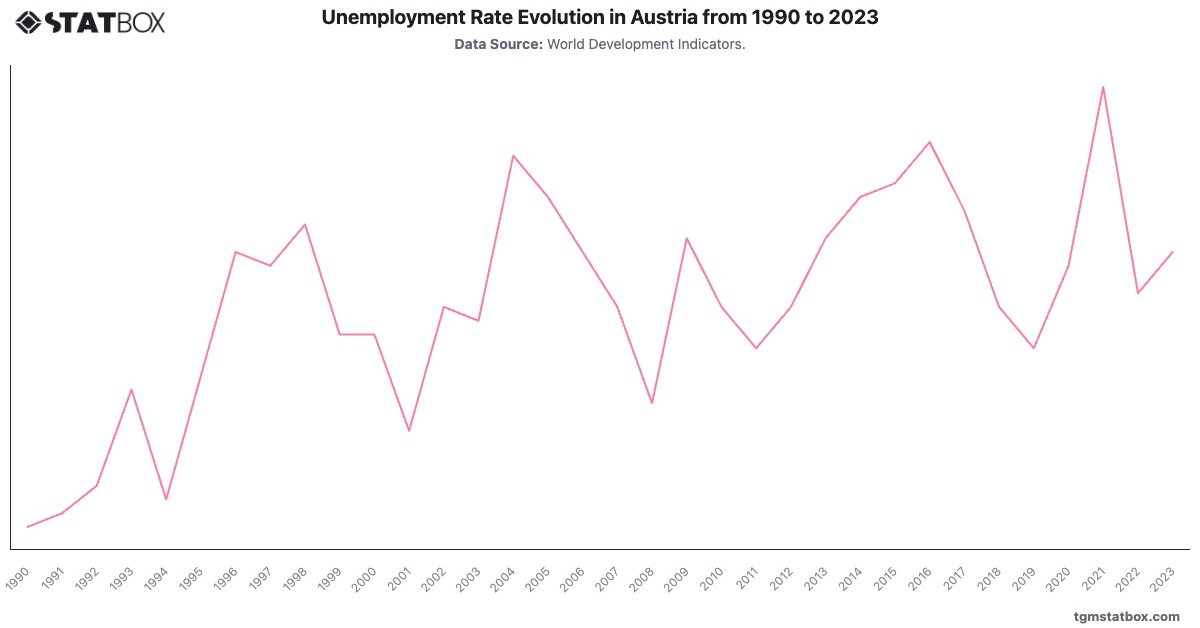
Austria's GDP growth has generally aligned with broader European economic conditions, marked by cycles of growth and recession. The 1960s and 1970s saw sustained growth, highlighted by a increase in 1970. The oil crisis of 1975 led to a slight contraction at -, but growth resumed thereafter. The 1980s featured periods of moderate growth, while the 1990s experienced stabilization and integration into the European Union. Austria's economy contracted during the global financial crisis in 2009 (-) and again during the 2020 pandemic, with a severe decline of -. The post-pandemic recovery was notable, with a growth rate in 2022, though challenges in 2023 saw a minor decline to -, reflecting economic adjustments.
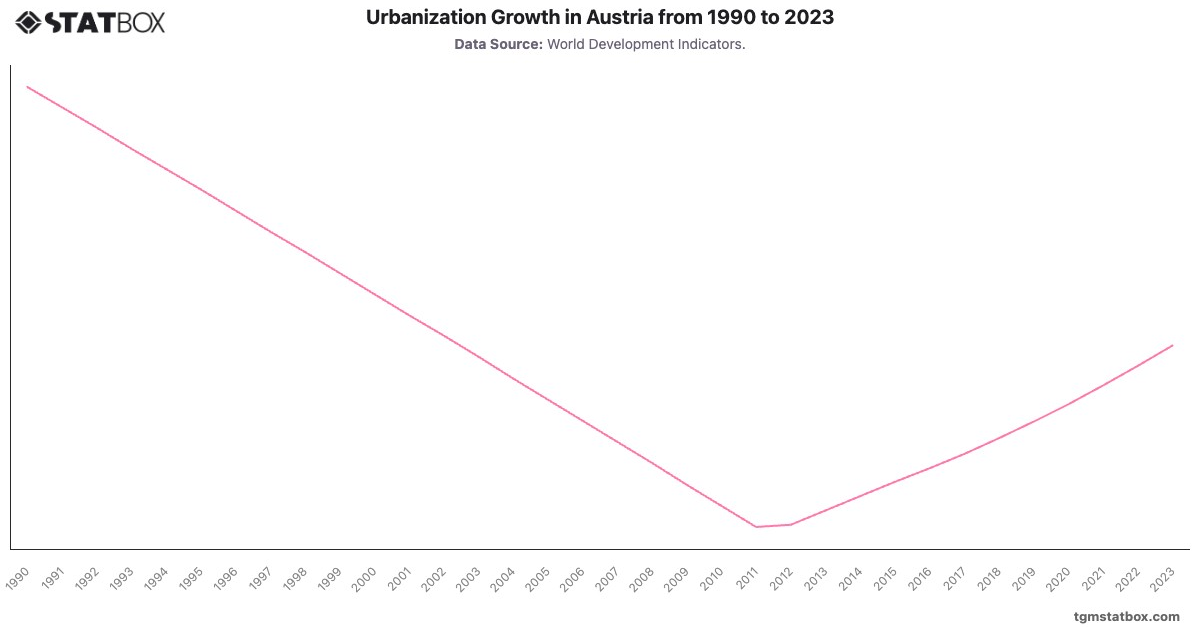
Explore related charts to gain a better understanding of Austria’s government debt-to-GDP ratio, Austria’s urbanization trends, Austria’s yearly GDP figures.