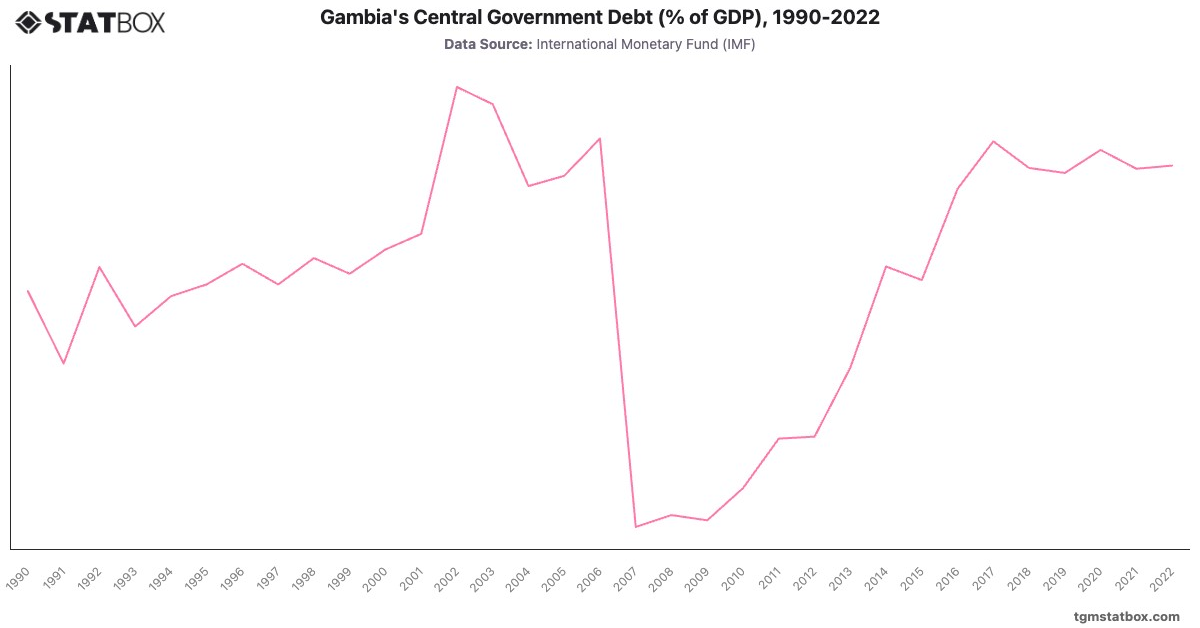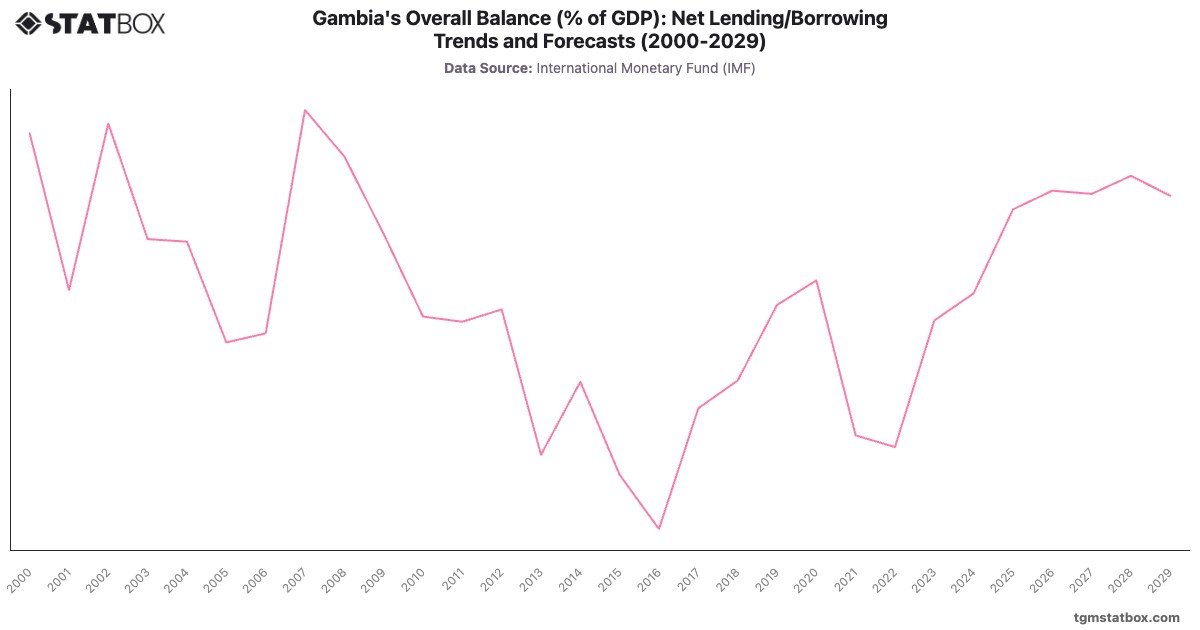
The Gambia's fiscal trends highlight volatility linked to economic and political shifts. In the 2000s, deficits were moderate, averaging -. A worsening fiscal situation emerged in the mid-2010s, with deficits peaking at - in 2016, reflecting rising public spending and economic mismanagement.
Recent improvements have seen deficits narrow to - in 2023, with projections indicating further progress to - by 2029. Sustained fiscal discipline and structural reforms will be key to maintaining this trajectory.
Recent improvements have seen deficits narrow to - in 2023, with projections indicating further progress to - by 2029. Sustained fiscal discipline and structural reforms will be key to maintaining this trajectory.
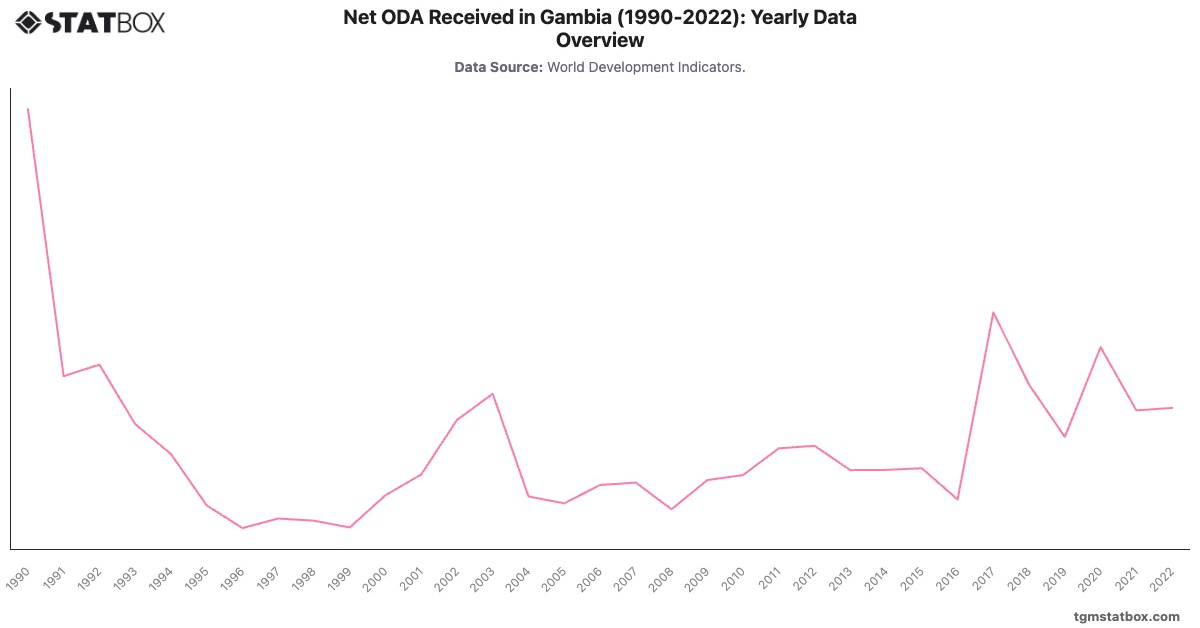
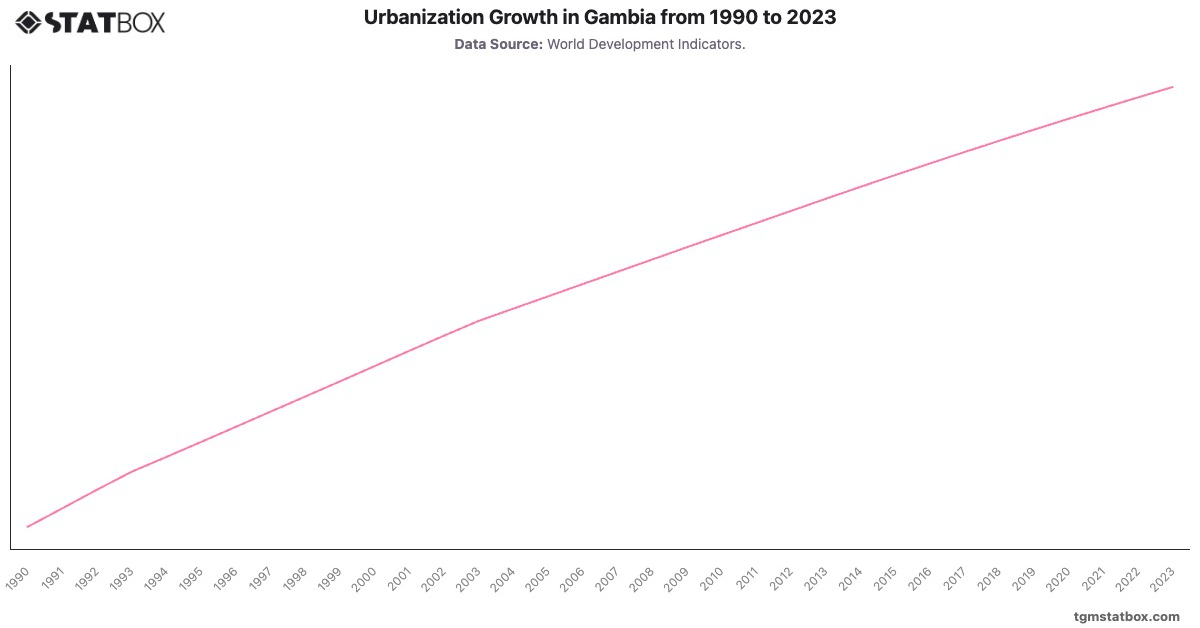
For a broader context, visit other statistics on Gambia’s goods trade balance, Gambia’s net ODA data, Gambia’s urbanization rise.