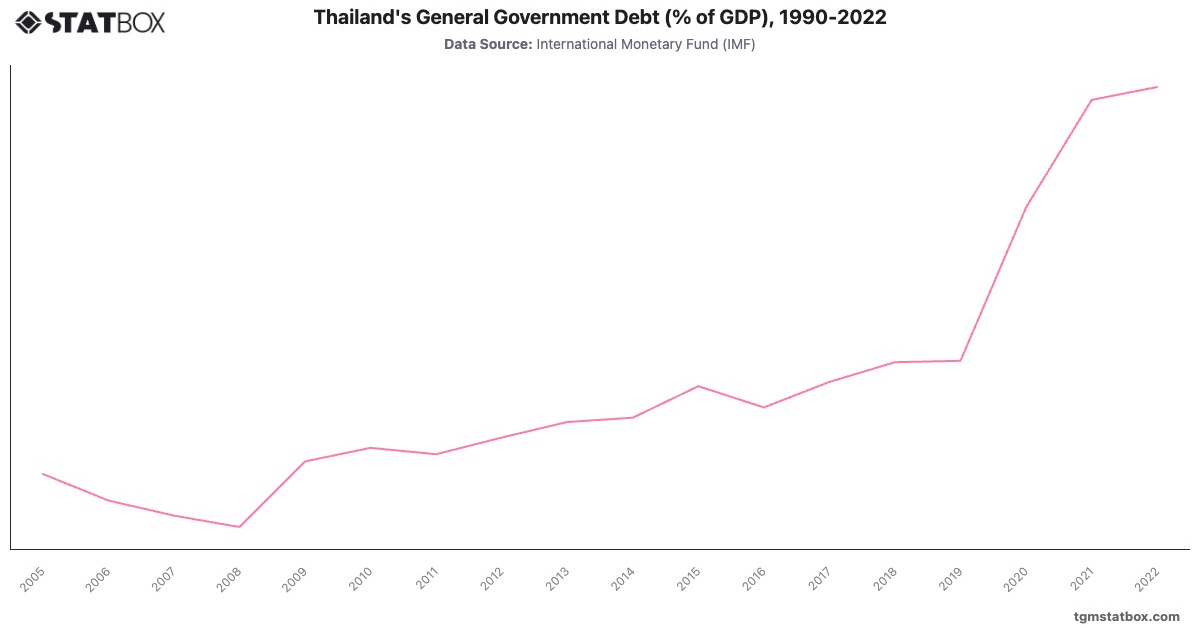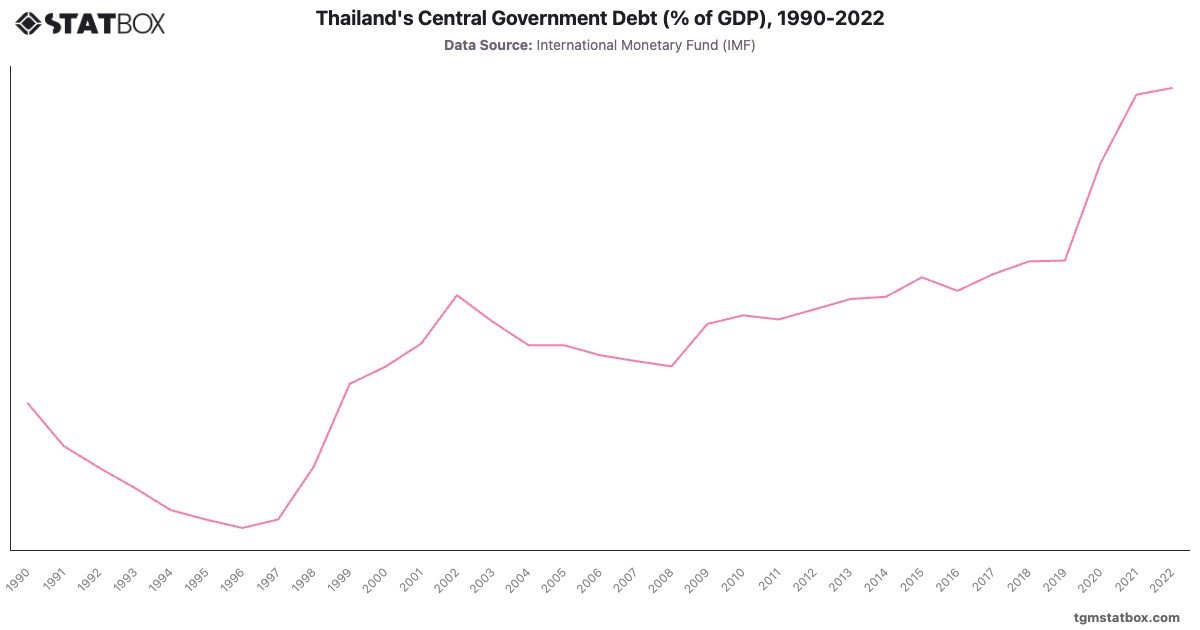
Thailand's central government debt exhibited a sharp decline from in 1990 to in 1996, attributed to rapid economic growth and fiscal discipline during the Thai economic boom. However, the 1997 Asian financial crisis reversed this trend, with debt surging to in 1998 and peaking at by 2002 as the government implemented recovery measures and structural reforms.
Post-crisis, debt levels stabilized and gradually declined to by 2008. However, the 2008 global financial crisis and subsequent domestic challenges resulted in an upward trend, reaching in 2014. Following steady growth, the COVID-19 pandemic led to a significant rise, with debt hitting in 2022, reflecting extensive economic stimulus efforts to counter the pandemic's impact.
Post-crisis, debt levels stabilized and gradually declined to by 2008. However, the 2008 global financial crisis and subsequent domestic challenges resulted in an upward trend, reaching in 2014. Following steady growth, the COVID-19 pandemic led to a significant rise, with debt hitting in 2022, reflecting extensive economic stimulus efforts to counter the pandemic's impact.
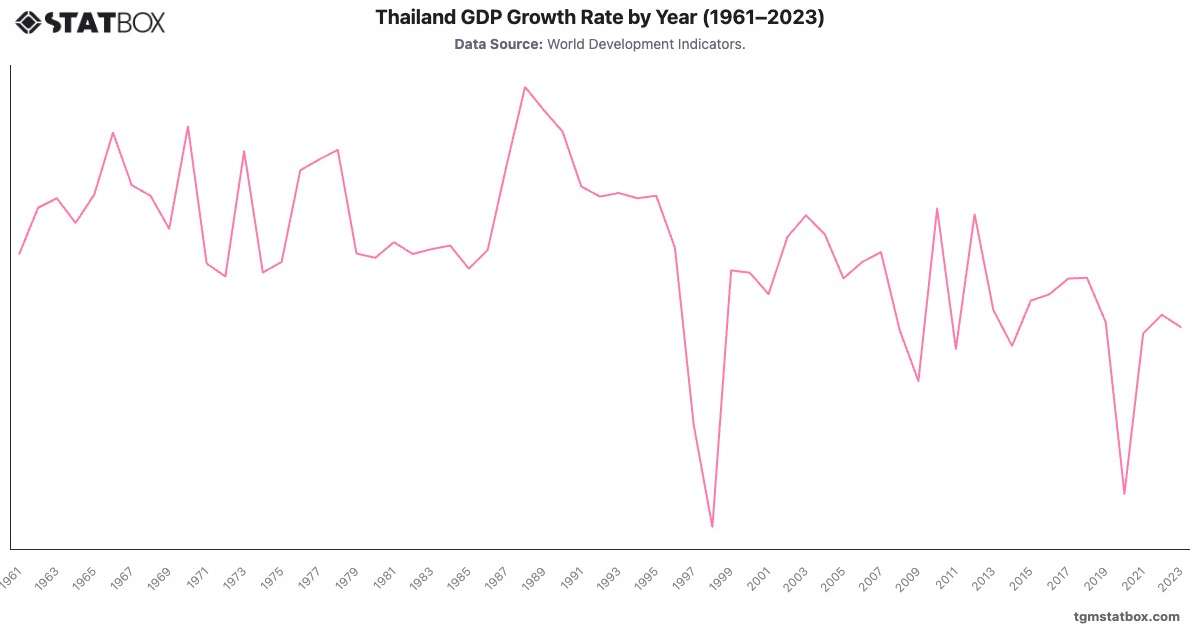
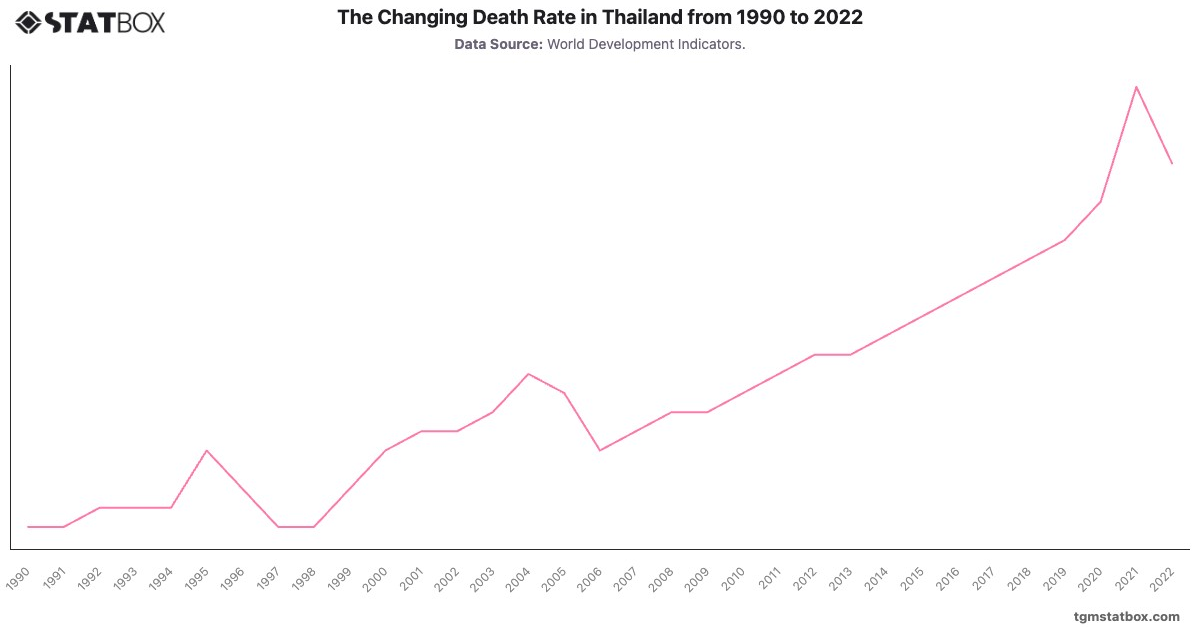
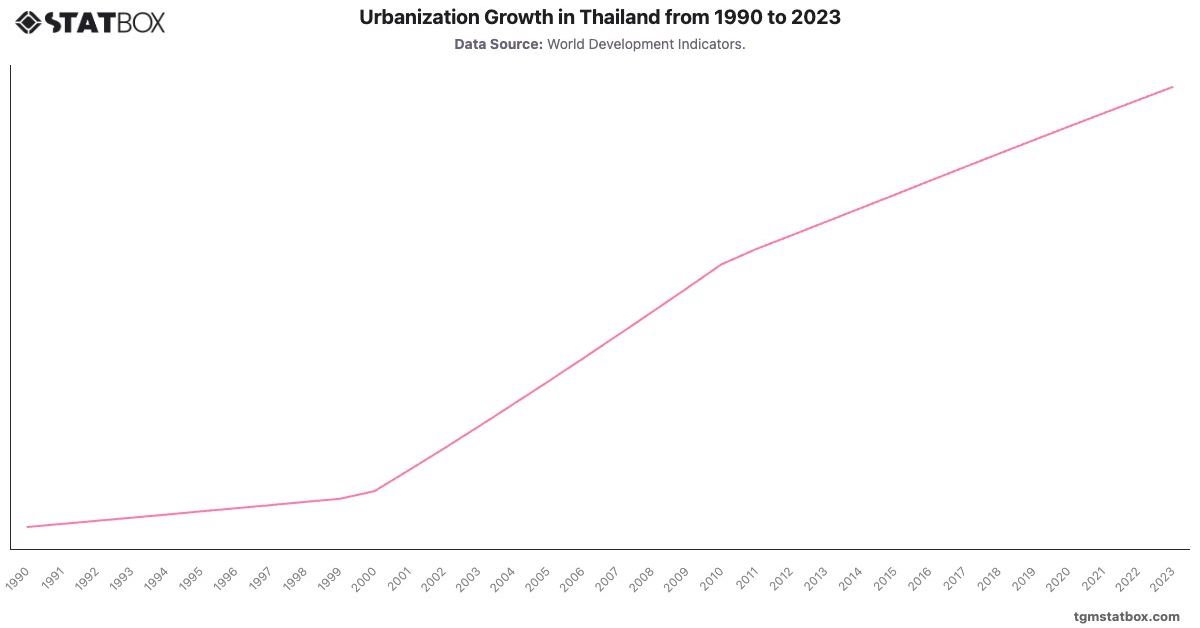
Find out more through related statistics on Thailand’s annual GDP figures, Thailand’s urbanization rate, import value from Thailand.