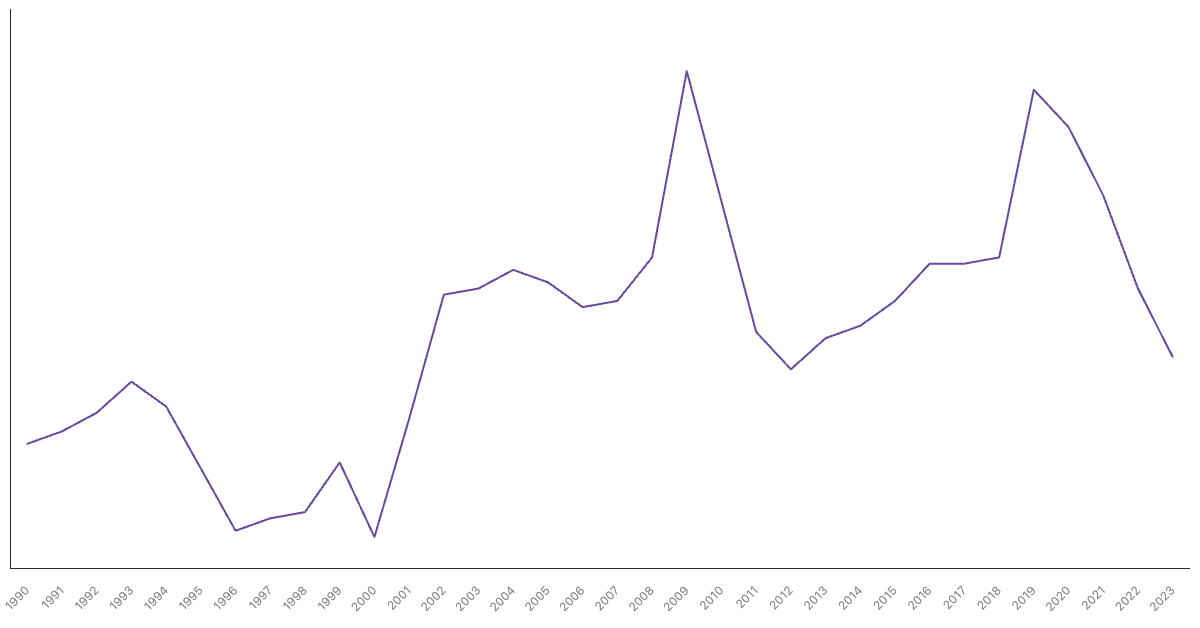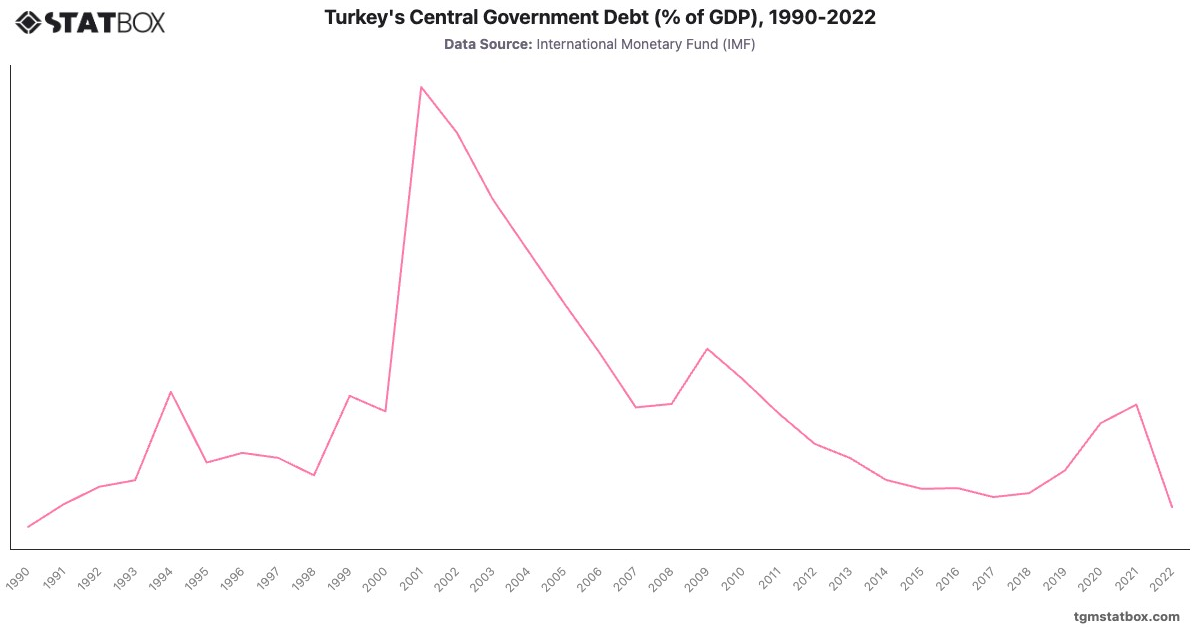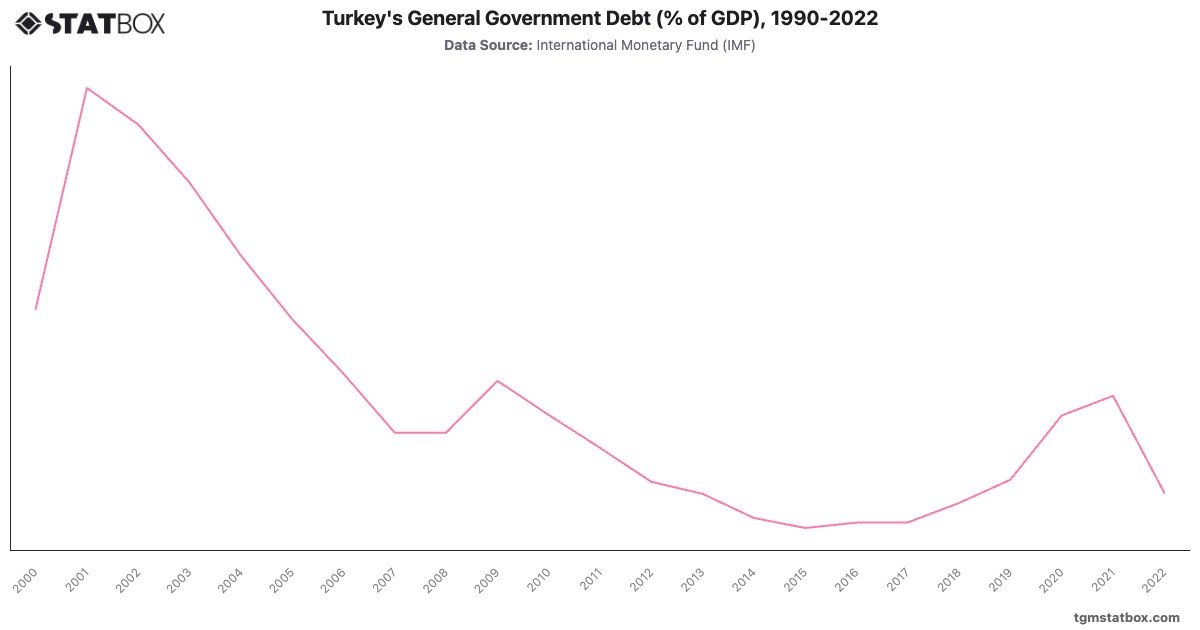
Turkey’s government debt-to-GDP ratio showed significant volatility, with a peak of in 2001 due to a severe financial crisis. Economic reforms, structural adjustments, and fiscal discipline over the following years brought debt down to by 2014. However, Turkey’s debt rose modestly in subsequent years due to political instability and economic challenges, reaching in 2020 as COVID-19 impacted Turkey’s economy.
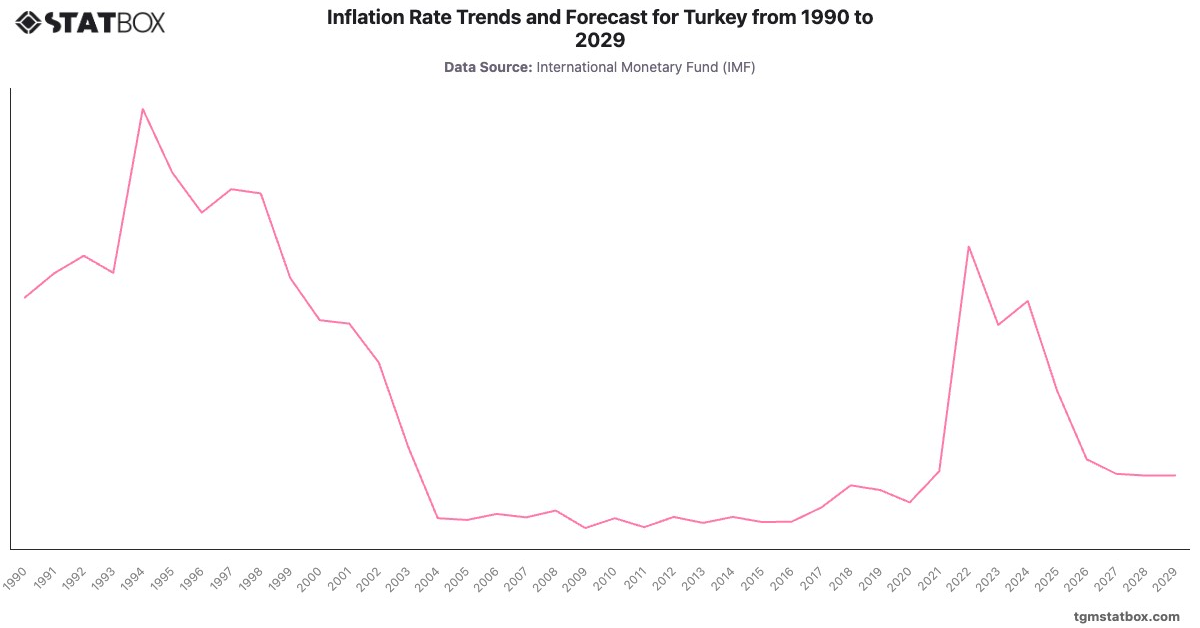
In 2021, debt continued to rise slightly, peaking at , but by 2022, it decreased to , reflecting Turkey’s ongoing efforts to manage fiscal policy amidst inflation and currency devaluation challenges. The recent reduction showcases Turkey’s resilience and fiscal adjustments, despite economic headwinds.
In 2021, debt continued to rise slightly, peaking at , but by 2022, it decreased to , reflecting Turkey’s ongoing efforts to manage fiscal policy amidst inflation and currency devaluation challenges. The recent reduction showcases Turkey’s resilience and fiscal adjustments, despite economic headwinds.
For additional information, visit statistics on Turkey’s annual GDP growth rate, Turkey’s industry sector GDP share, Turkey’s central government debt ratio.