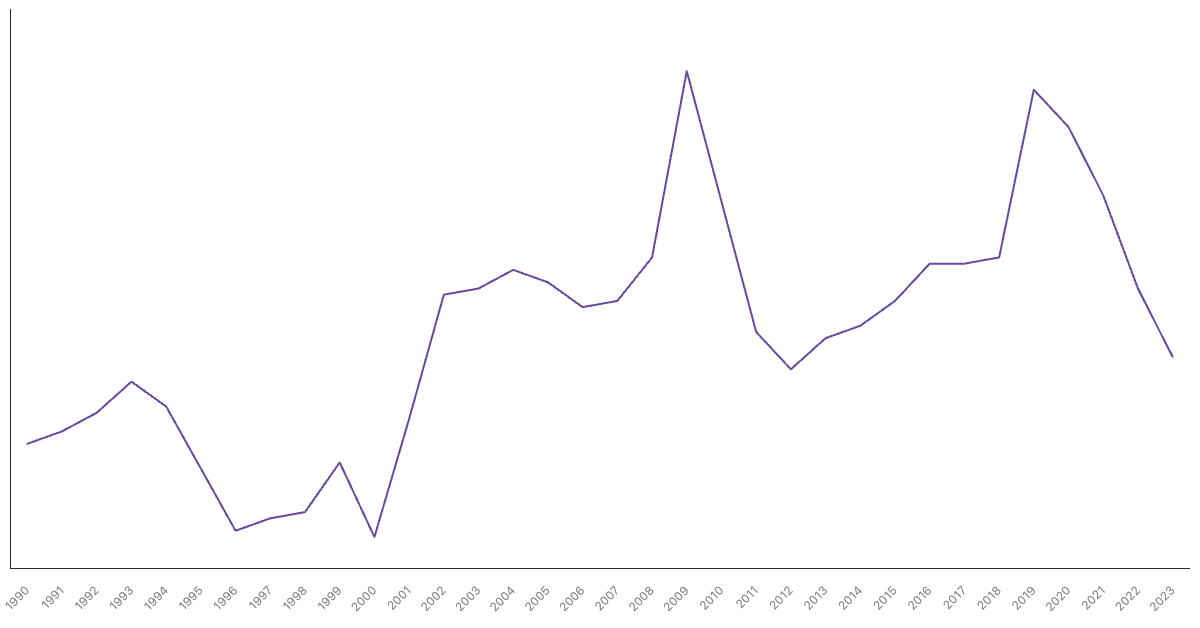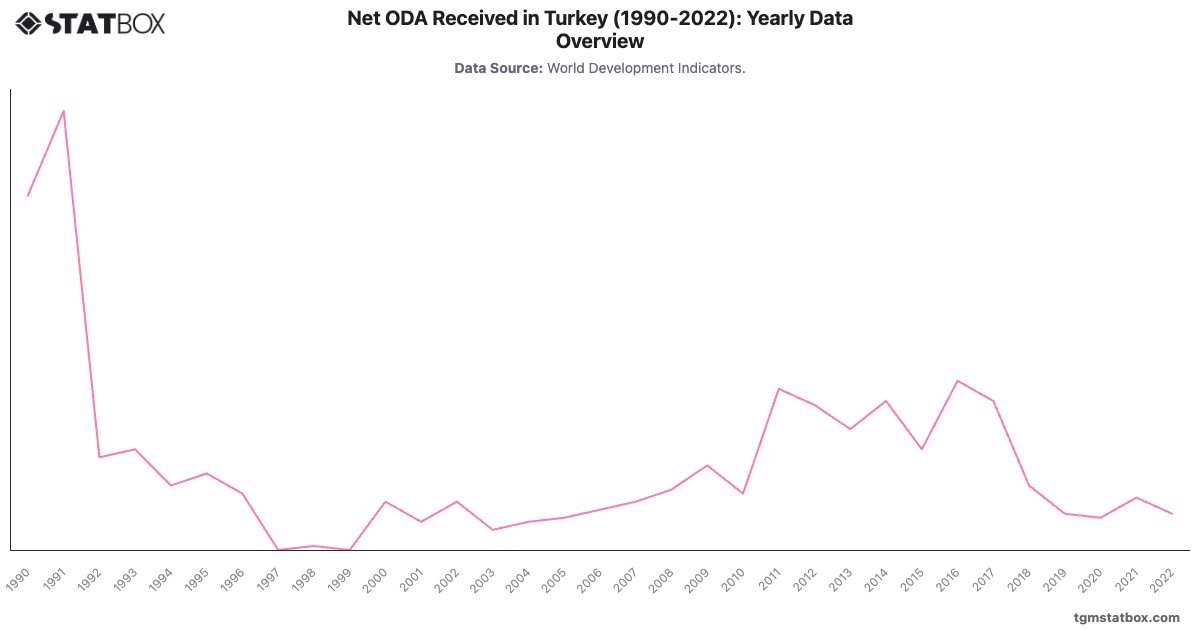
Turkey’s Net ODA (% of GNI) was highest in 1991 at , reflecting international support during economic adjustments. Aid levels rapidly declined in the 1990s as Turkey’s economy strengthened, stabilizing at near-zero levels post-2000.
The slight increase to in 2011-2012 corresponds to support for refugee and migration management during regional crises. Turkey’s low ODA levels reflect its status as a donor country in recent decades.
The slight increase to in 2011-2012 corresponds to support for refugee and migration management during regional crises. Turkey’s low ODA levels reflect its status as a donor country in recent decades.
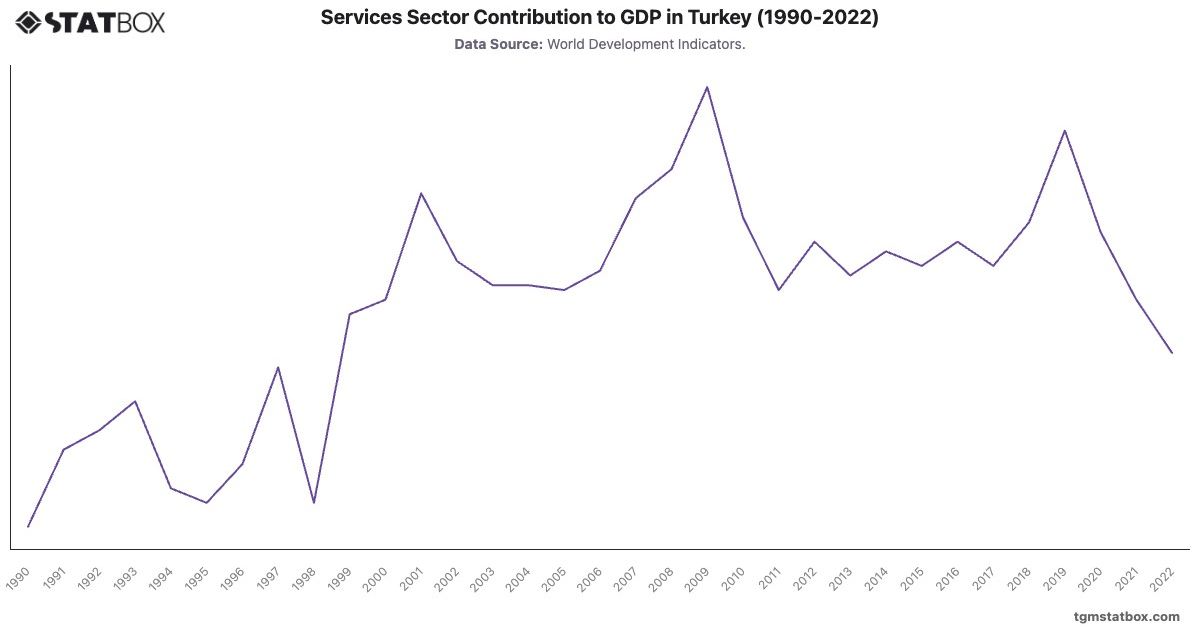
Explore related charts to gain a better understanding of Turkey’s industry sector GDP share, Turkey’s services sector share in GDP, Turkey’s general government debt as a share of GDP.