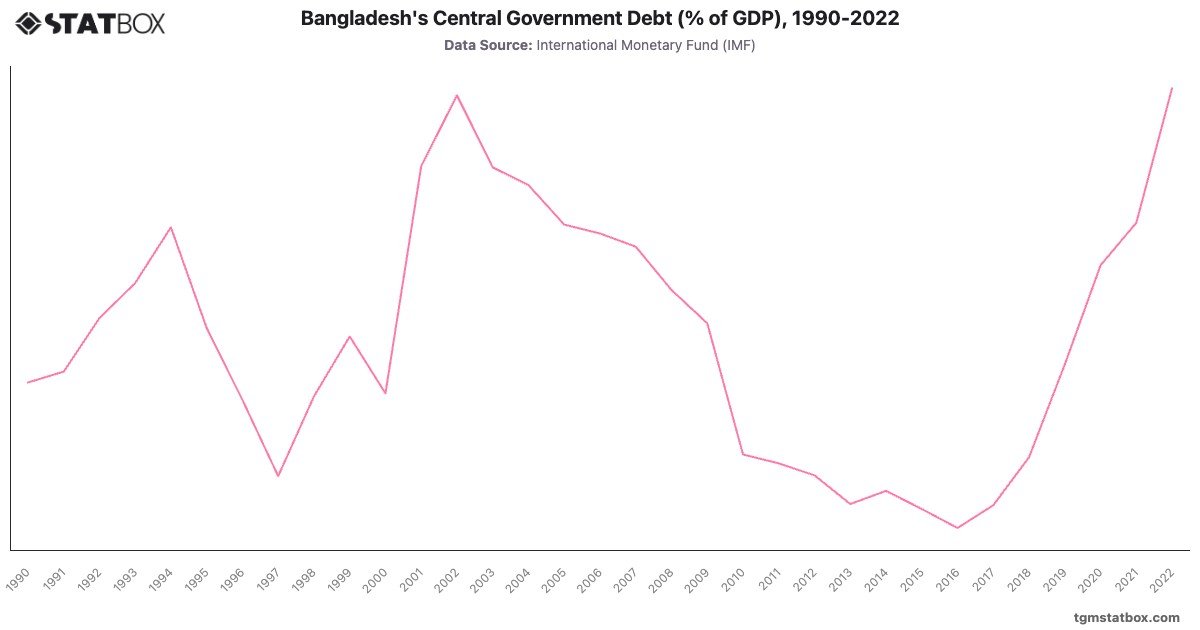
From 1990 to 2022, Bangladesh's central government debt as a percentage of GDP displayed a steady yet dynamic trajectory. The early 1990s marked a gradual increase, peaking at in 1994 due to developmental expenditures and economic reforms. This was followed by a decline, with debt levels reaching in 1997, reflecting prudent fiscal management and economic growth.
Post-2000, the debt-to-GDP ratio saw moderate fluctuations. The increase to in 2002 coincided with global economic slowdowns, impacting export-driven economies. However, sustained growth and effective debt management reduced the ratio to in 2013. A slight upward trend emerged after 2019, with the ratio rising to in 2022, largely driven by pandemic-related fiscal stimulus and infrastructure investments.
Post-2000, the debt-to-GDP ratio saw moderate fluctuations. The increase to in 2002 coincided with global economic slowdowns, impacting export-driven economies. However, sustained growth and effective debt management reduced the ratio to in 2013. A slight upward trend emerged after 2019, with the ratio rising to in 2022, largely driven by pandemic-related fiscal stimulus and infrastructure investments.
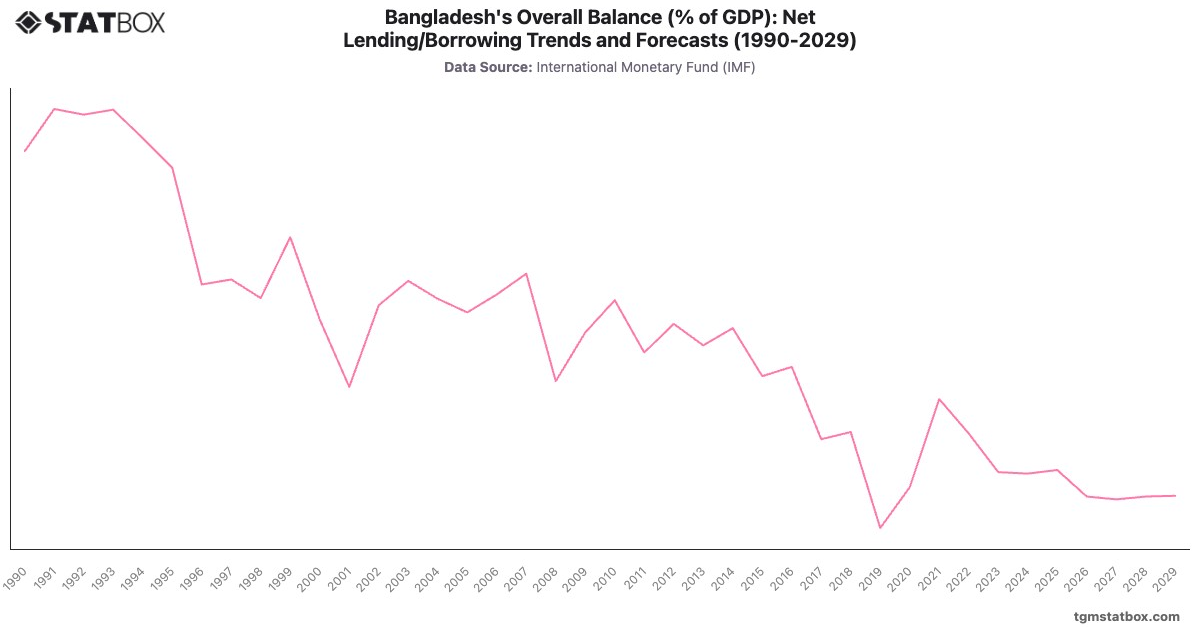
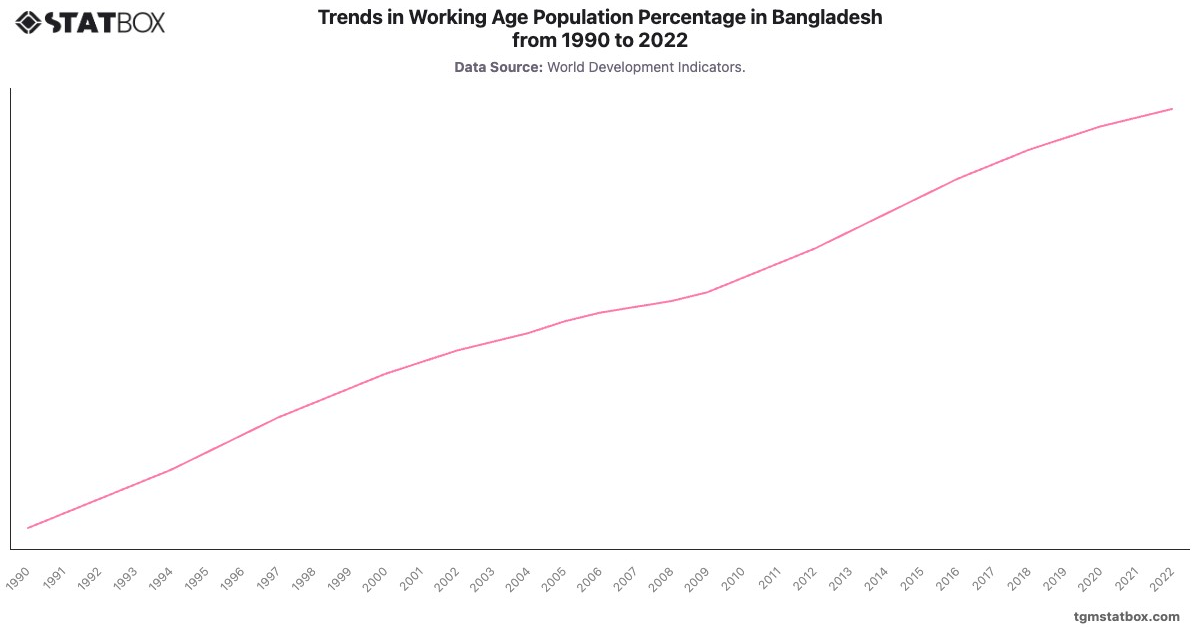
Discover additional trends and data on Bangladesh’s population growth, Bangladesh’s agriculture sector GDP share, Bangladesh’s net lending/borrowing balance.