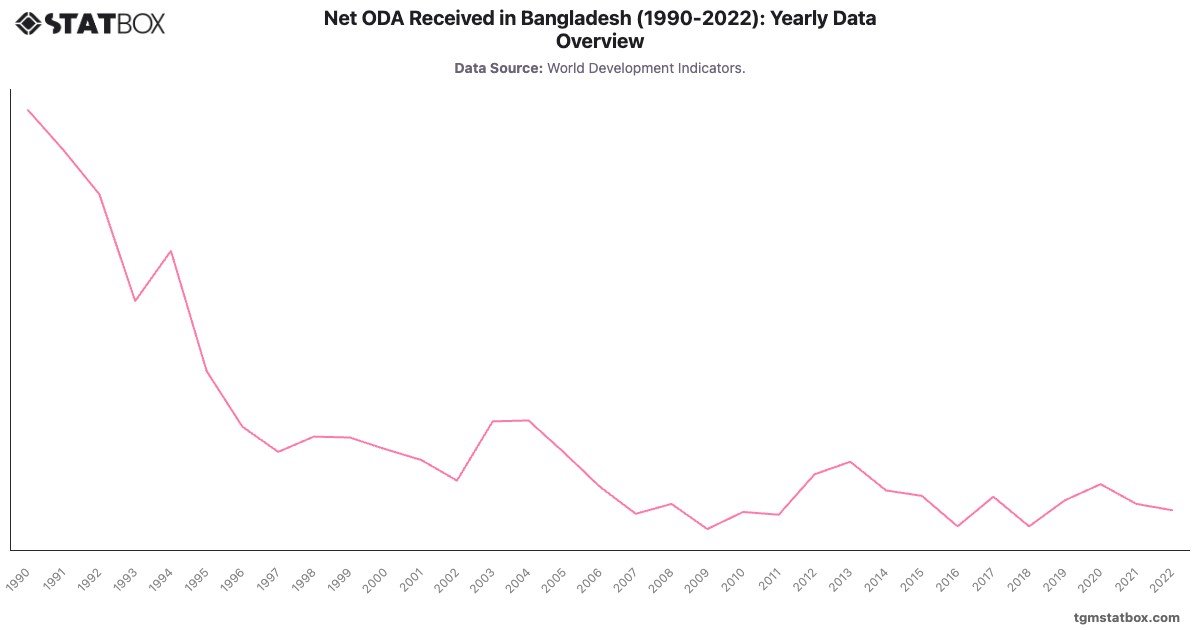
Bangladesh's Net ODA (% of GNI) declined steadily from in 1990 to under by the mid-2000s, reflecting its transition from heavy donor dependency to a more self-sustained development model. The early 1990s marked significant aid flows aimed at poverty alleviation, infrastructure development, and disaster management.
Post-2000, ODA contributions stabilized at lower levels, with fluctuations tied to natural disasters such as cyclones and floods, which spurred short-term increases in aid. For example, the uptick to in 2012 coincided with responses to humanitarian needs. Bangladesh's economic resilience and global recognition as a rising economy have since reduced its reliance on traditional ODA, maintaining levels around into the 2020s.
Post-2000, ODA contributions stabilized at lower levels, with fluctuations tied to natural disasters such as cyclones and floods, which spurred short-term increases in aid. For example, the uptick to in 2012 coincided with responses to humanitarian needs. Bangladesh's economic resilience and global recognition as a rising economy have since reduced its reliance on traditional ODA, maintaining levels around into the 2020s.
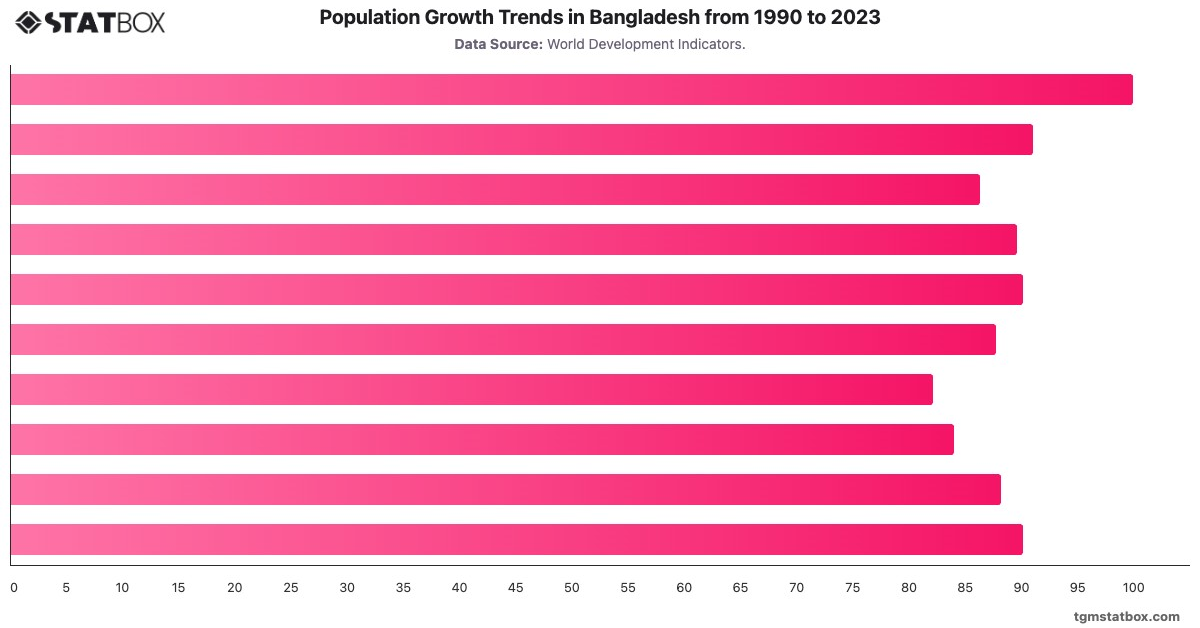
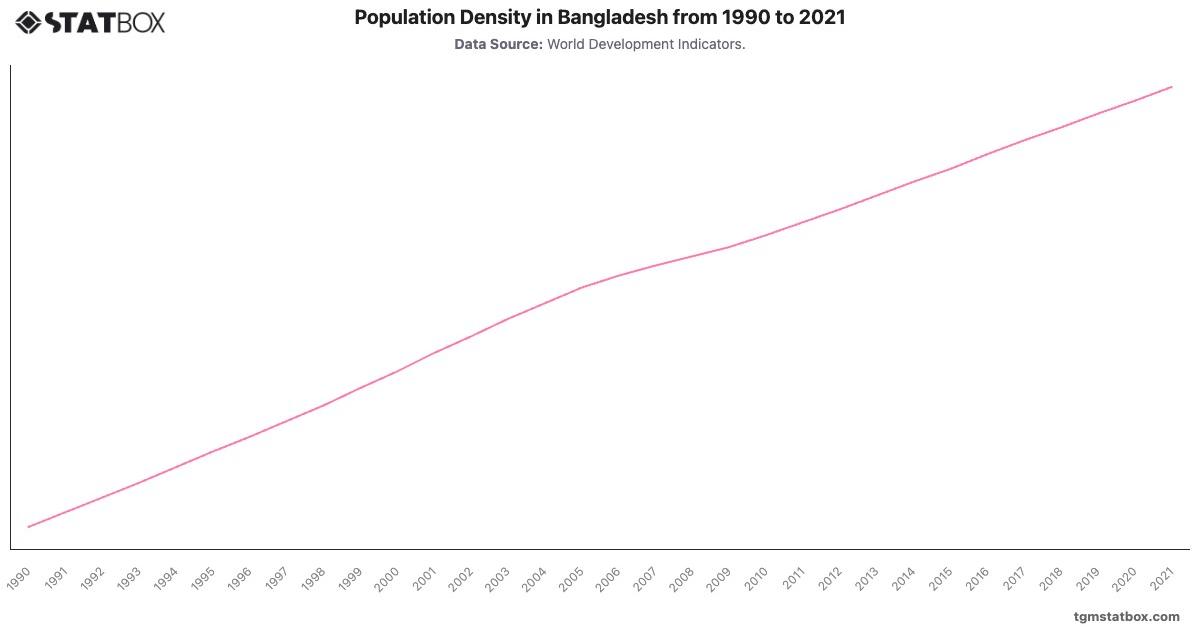
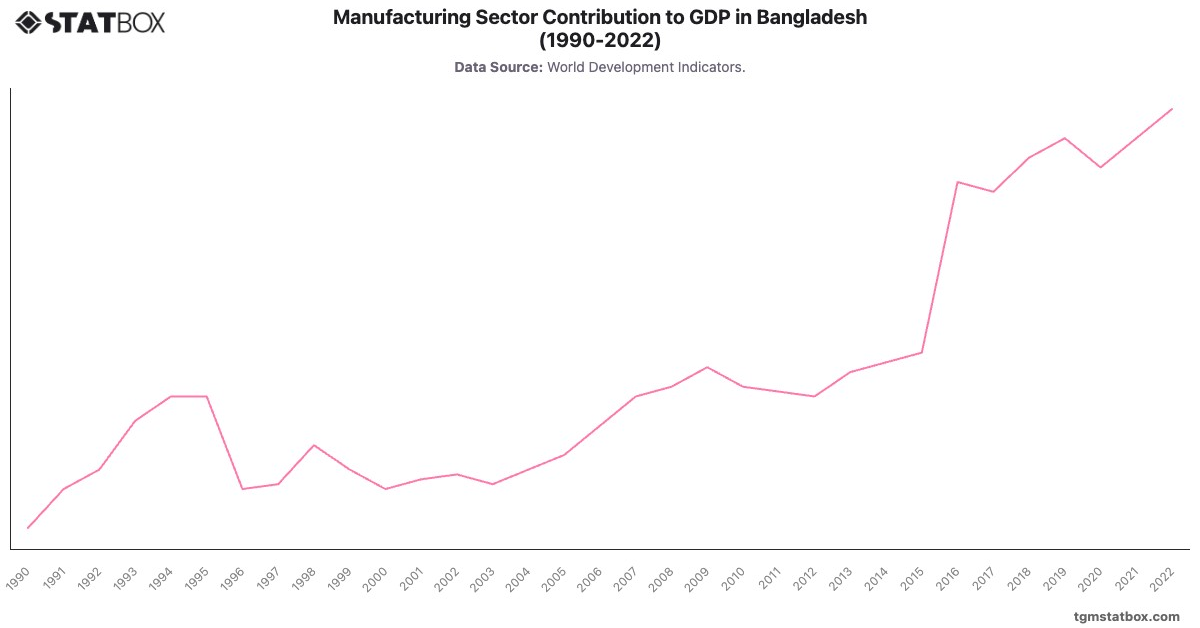
For a broader context, visit other statistics on Bangladesh’s population growth, Bangladesh’s industry sector share in GDP, Bangladesh’s manufacturing sector GDP share.