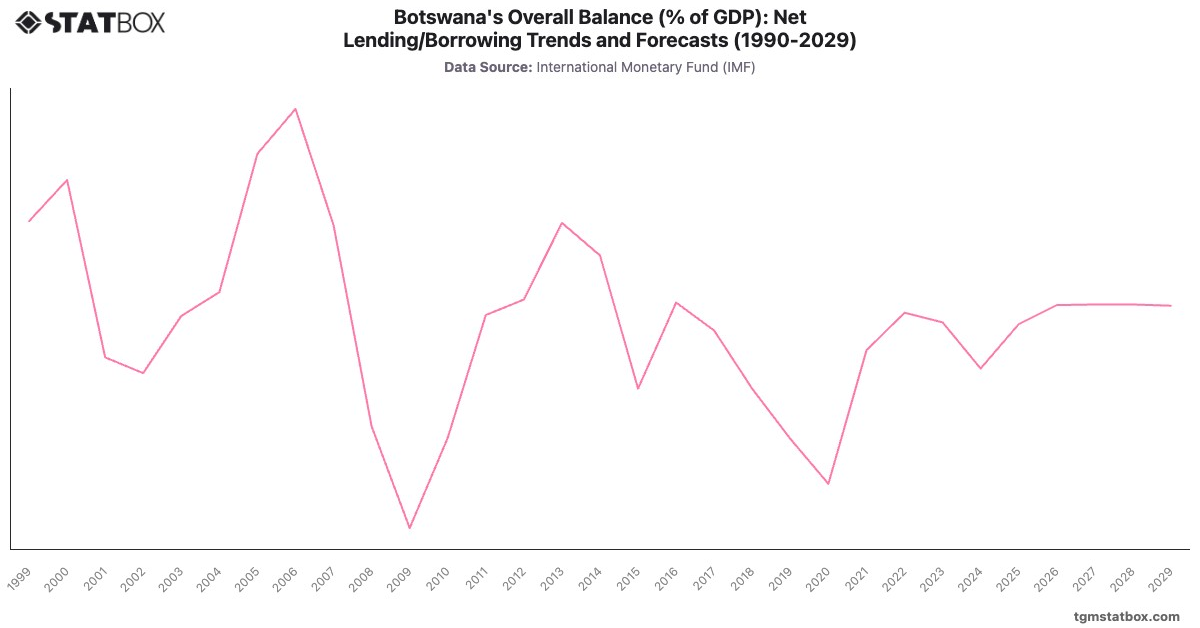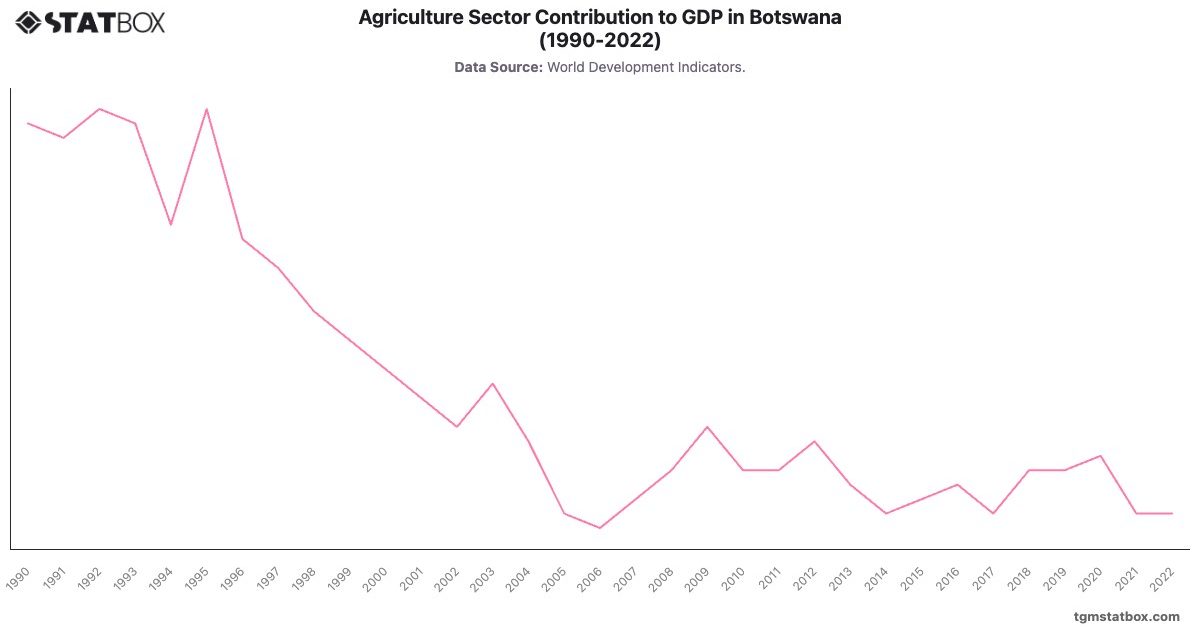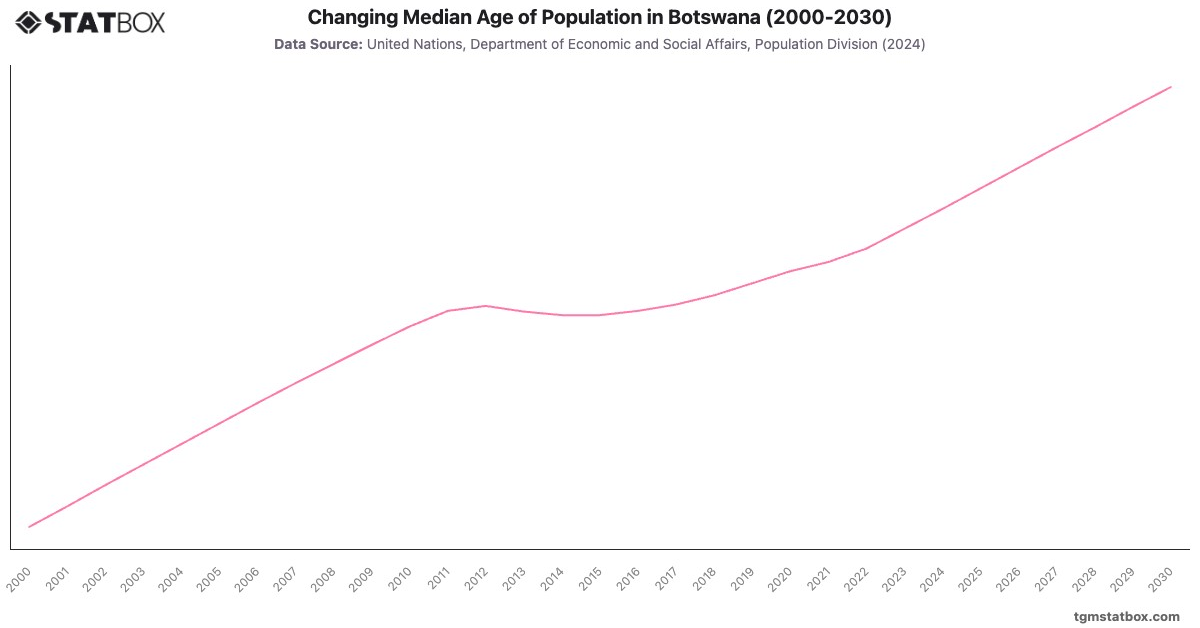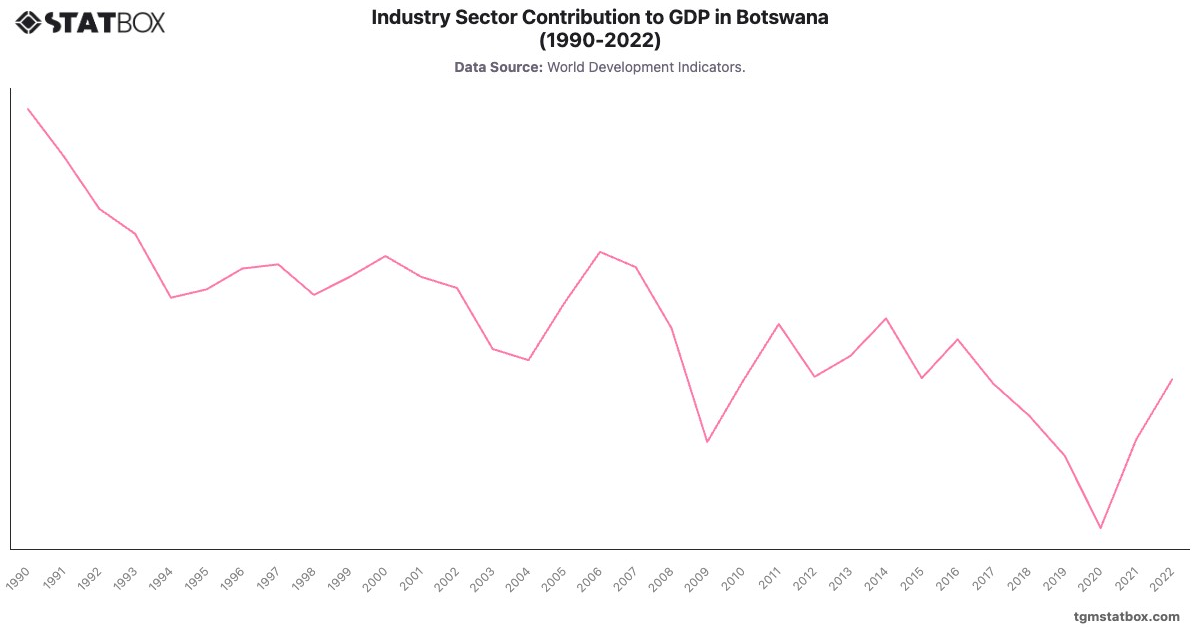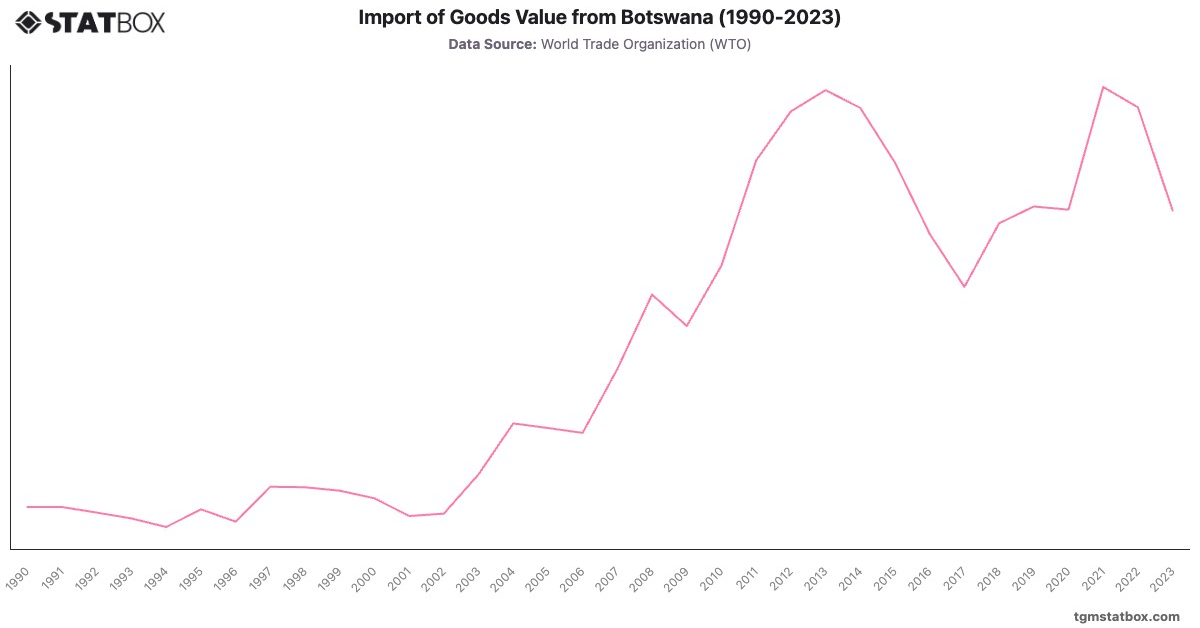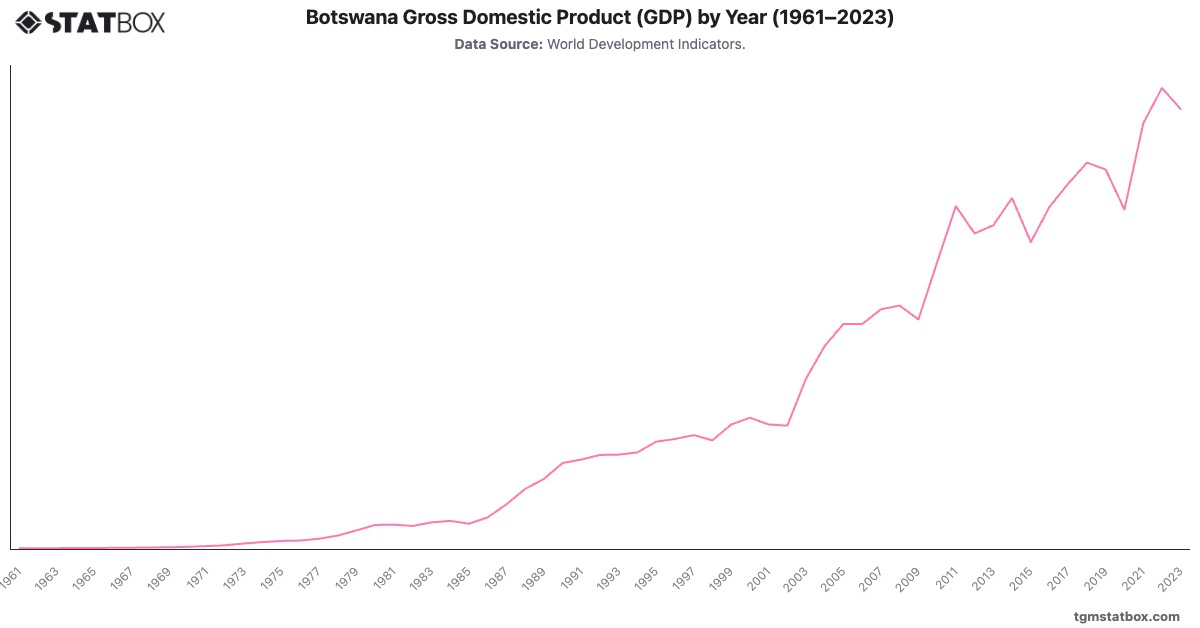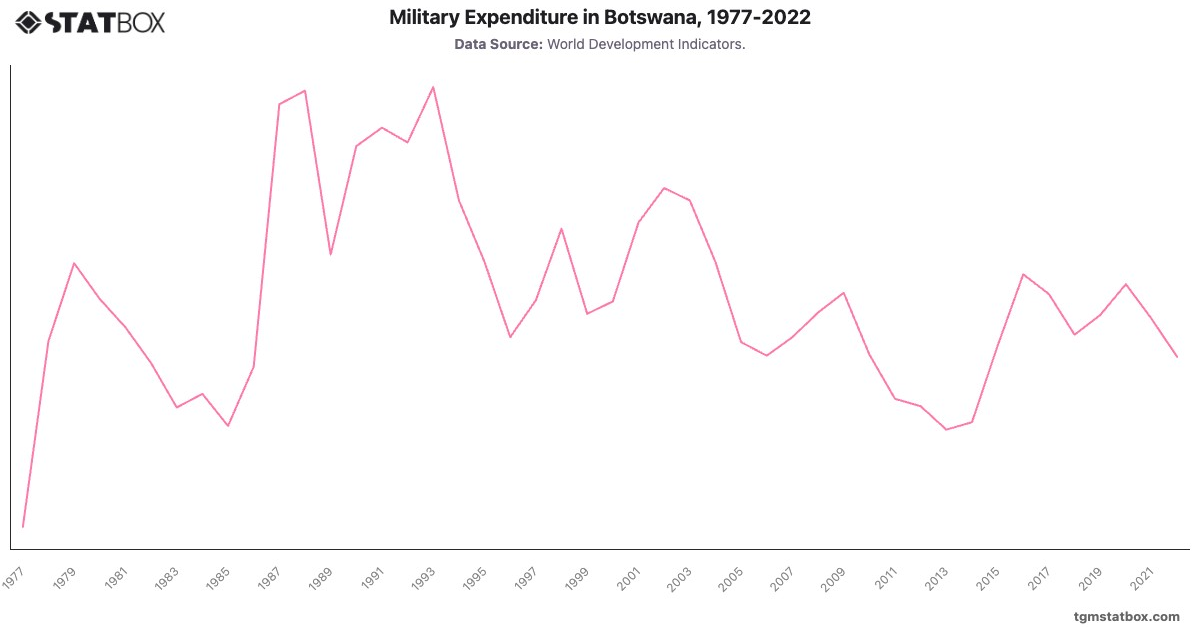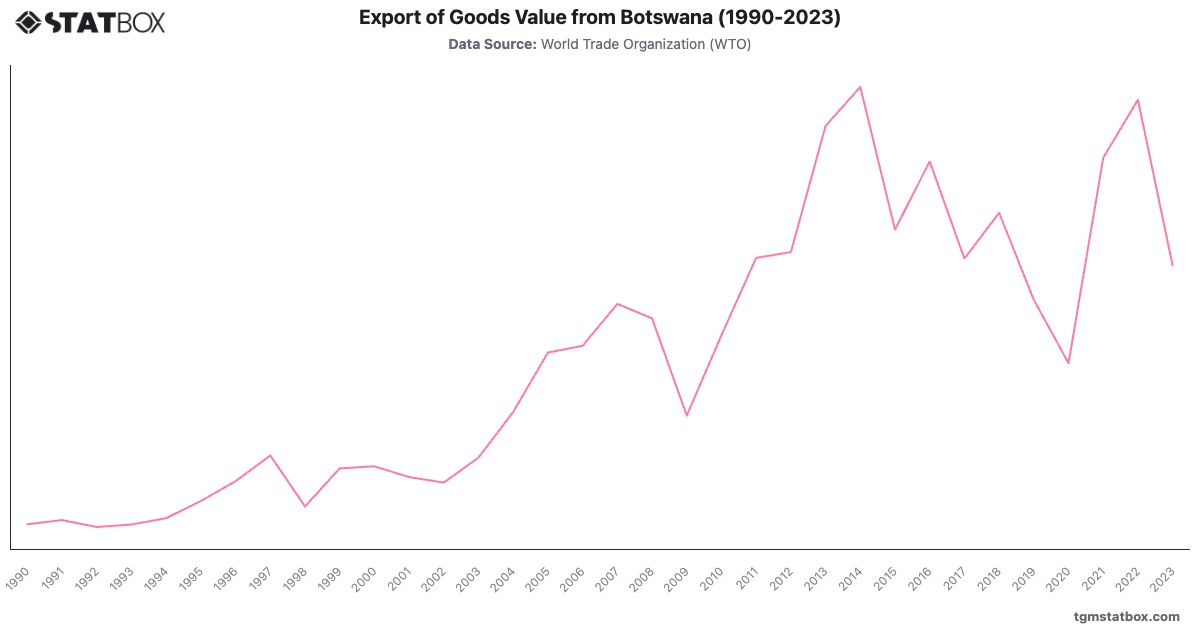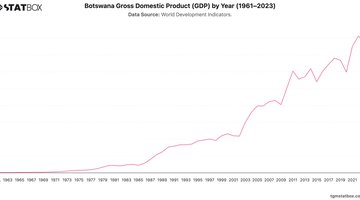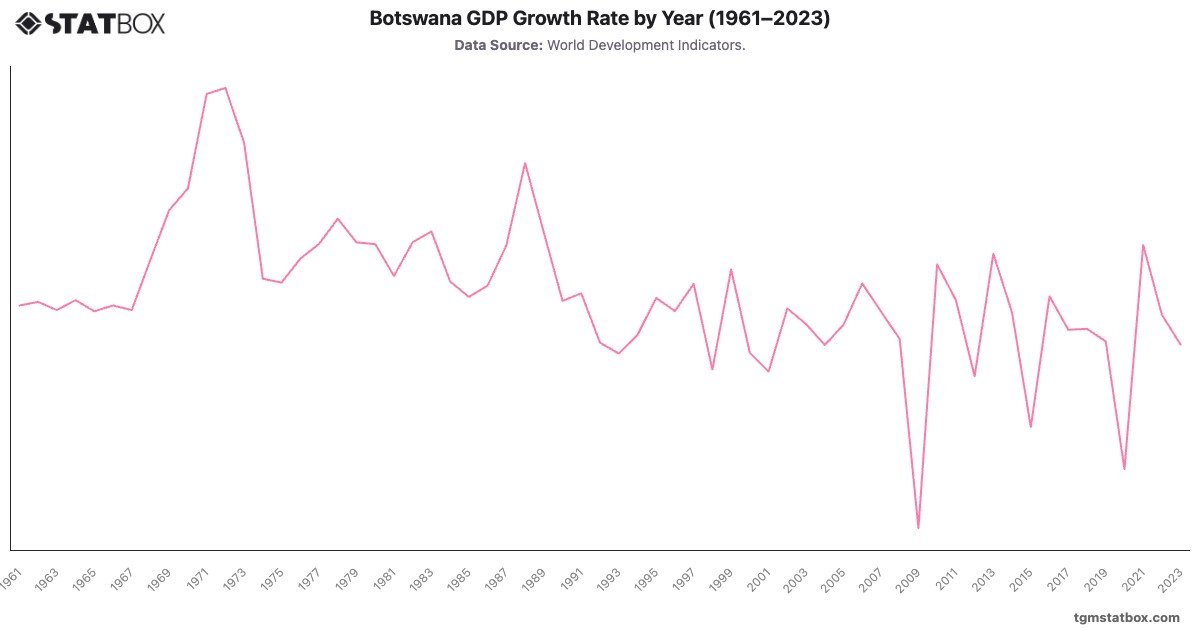
The chart illustrating Botswana's GDP growth rate from 1961 to 2023 reveals significant fluctuations and trends in the country's economic performance over the decades. The data indicates a period of robust growth, particularly in the late 1990s, with peak growth rates reaching over in 1971 and 1972, largely fueled by diamond mining and investments. However, Botswana's economy also faced challenges, including negative growth in 2009 and 2020, attributed to global economic downturns and the impacts of the COVID-19 pandemic. More recently, the economy has shown resilience with a rebound in growth, highlighting Botswana's ability to adapt and recover from external shocks.
Discover additional trends and data on Botswana’s population figures, Botswana’s urbanization rate, Botswana’s goods export value.