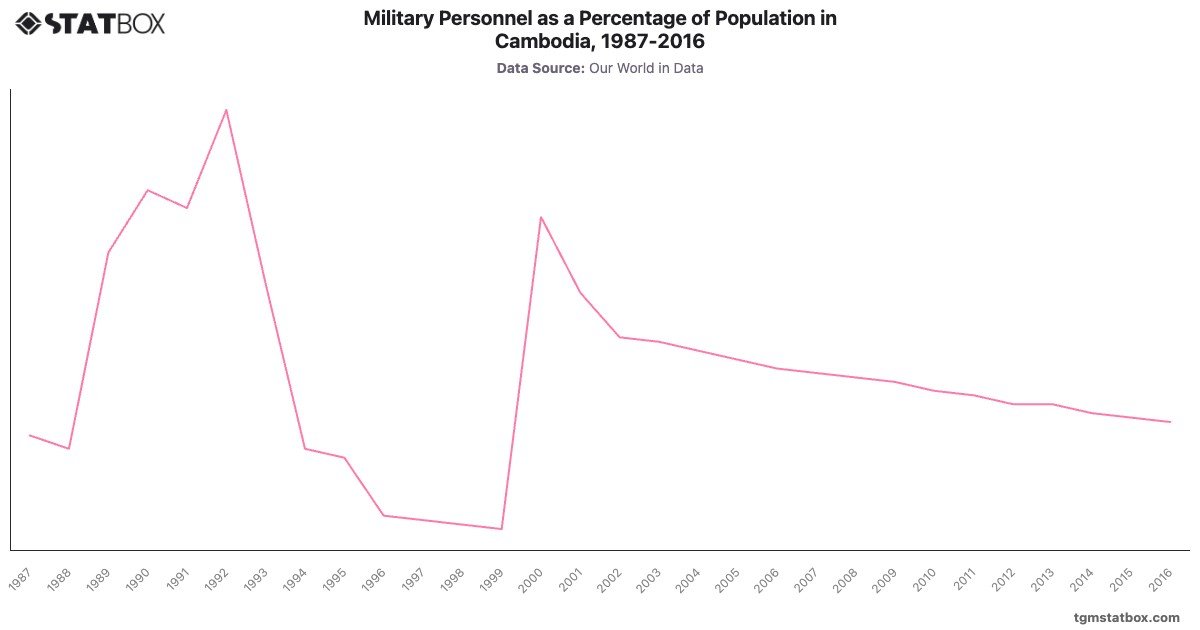
The chart depicting military personnel as a percentage of the population in Cambodia from 1987 to 2016 reveals a dynamic trend influenced by the country’s historical context. Initially, in 1987, the percentage stood at , with slight fluctuations in the following years. Notably, there was a peak in 1989 at , followed by a maximum of in 1992, likely reflecting the post-conflict efforts to rebuild and strengthen the military.
However, this upward trend was not sustained, as the percentage dropped to by 1999, indicating a reduction in military personnel relative to the population. Throughout the 2000s, the percentage stabilized around , suggesting a consistent military presence in relation to the growing population. By 2016, the figure returned to , highlighting a trend towards maintaining a steady military size amid changing demographic dynamics.
However, this upward trend was not sustained, as the percentage dropped to by 1999, indicating a reduction in military personnel relative to the population. Throughout the 2000s, the percentage stabilized around , suggesting a consistent military presence in relation to the growing population. By 2016, the figure returned to , highlighting a trend towards maintaining a steady military size amid changing demographic dynamics.
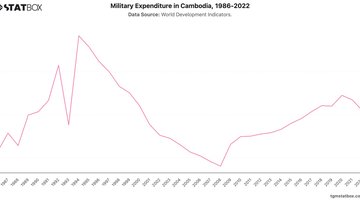
Explore related charts to gain a better understanding of Cambodia’s military spending, Cambodia’s working-age population share, overview of cambodia’s military personnel.