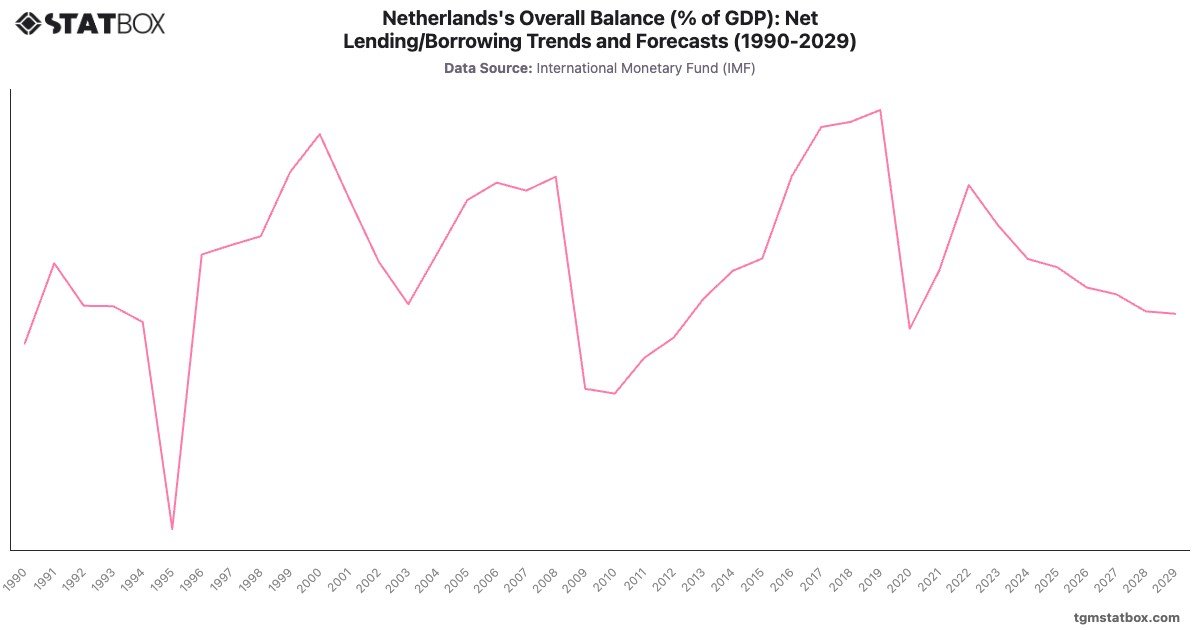
The Netherlands’ fiscal history highlights strong economic management with periods of volatility. The early 1990s faced deficits of up to -, exacerbated by reunification costs. The introduction of fiscal discipline saw surpluses emerge by the late 1990s, with a peak of in 2019.
The pandemic caused a temporary reversal, with deficits reaching - in 2020. Although forecasts predict gradual declines in fiscal health, with deficits at - by 2029, the Netherlands remains well-positioned for recovery due to its strong economic foundations.
The pandemic caused a temporary reversal, with deficits reaching - in 2020. Although forecasts predict gradual declines in fiscal health, with deficits at - by 2029, the Netherlands remains well-positioned for recovery due to its strong economic foundations.
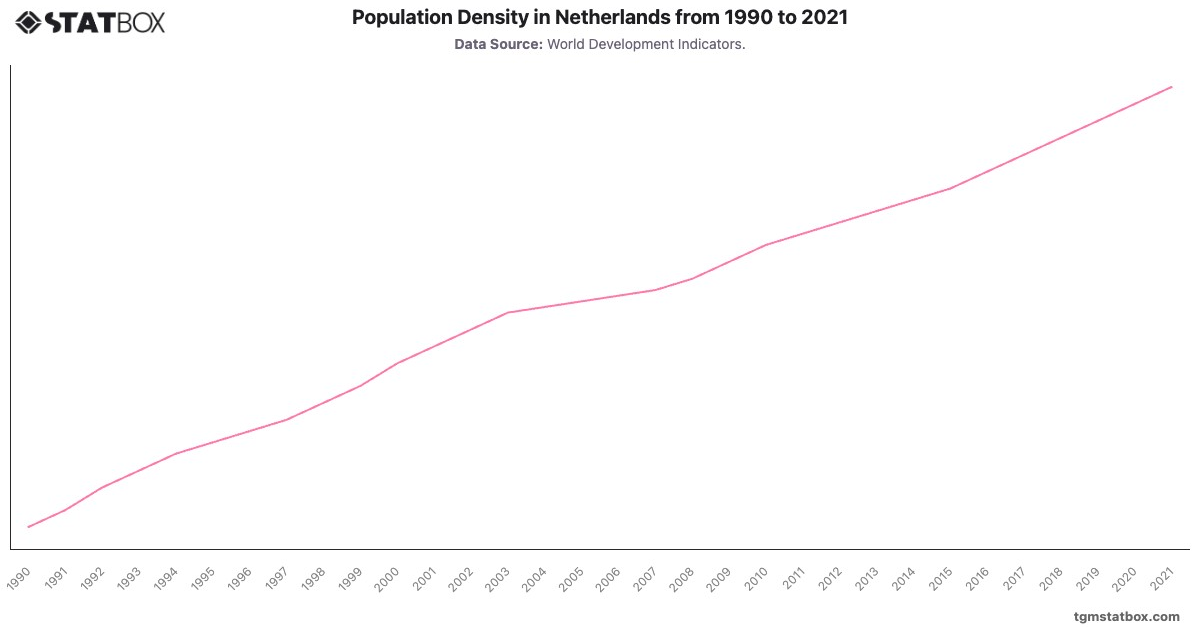
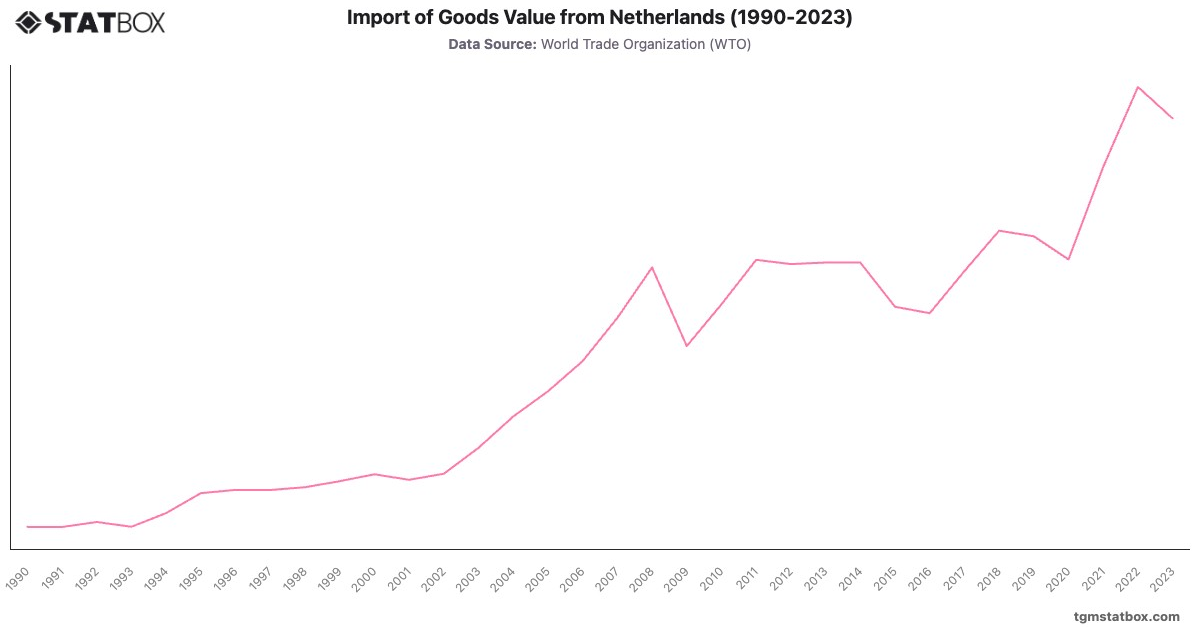
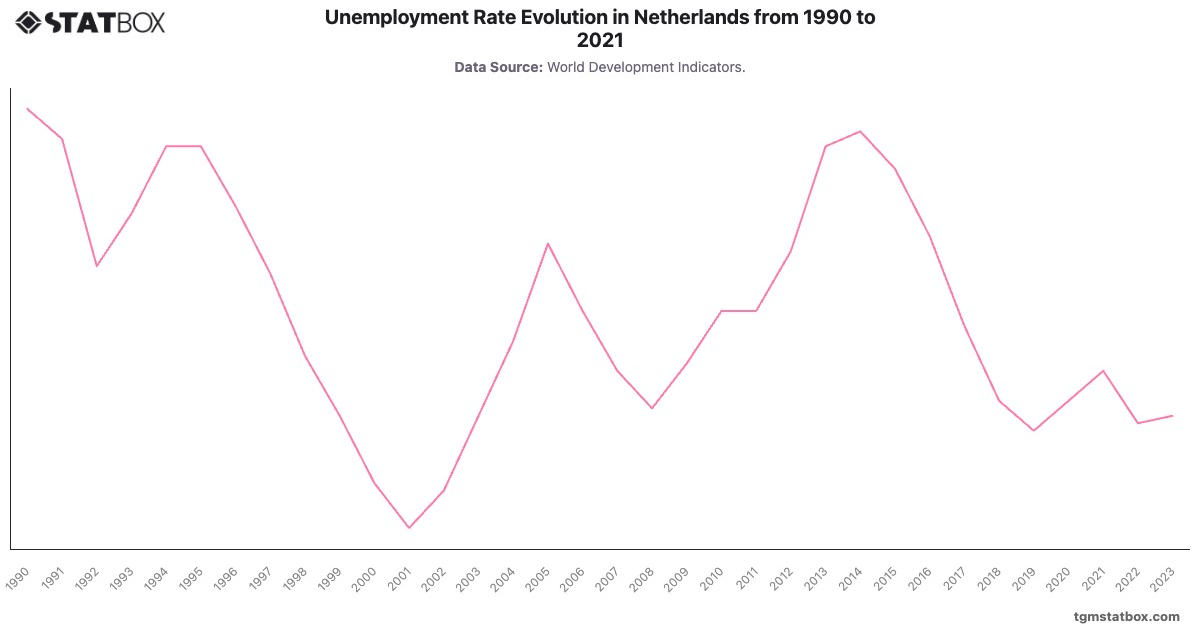
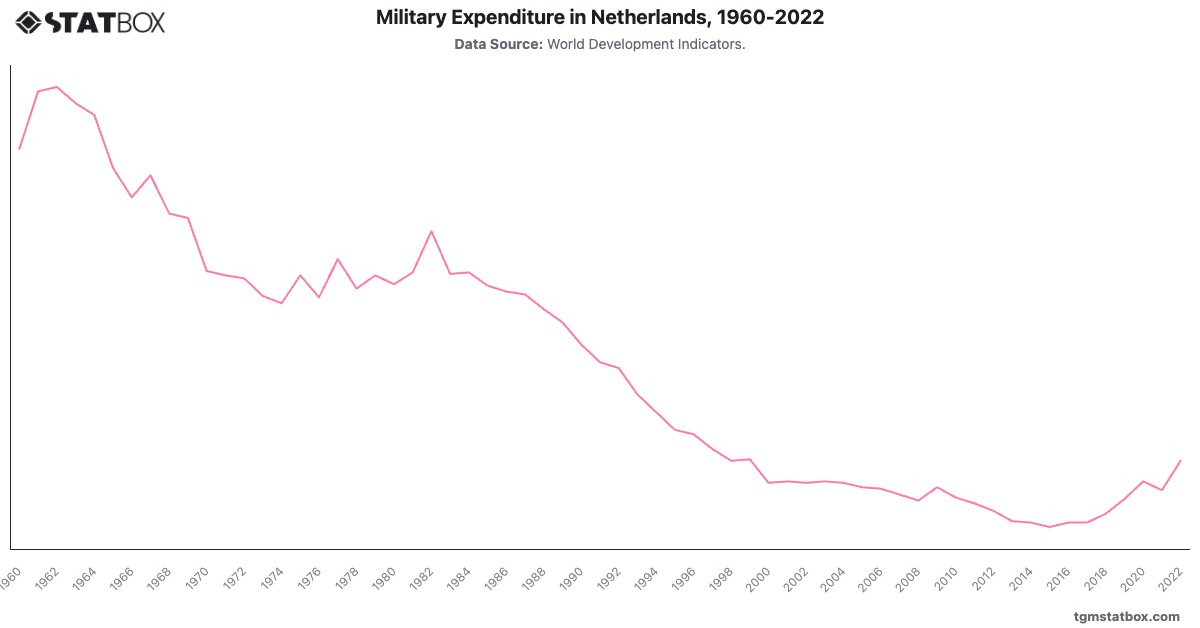
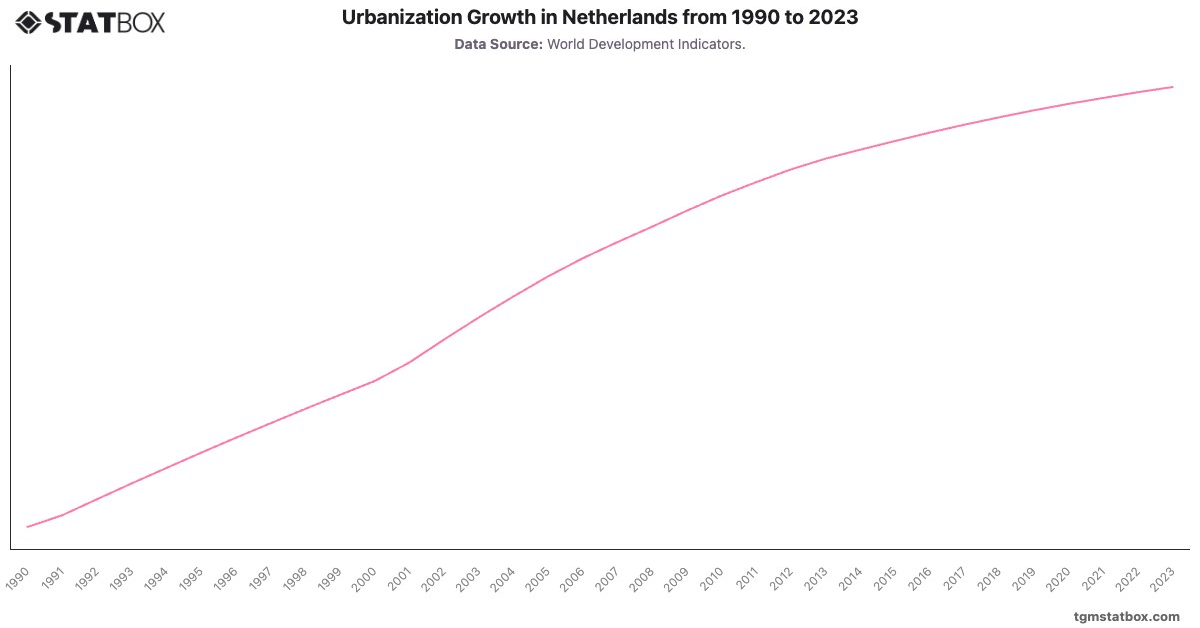
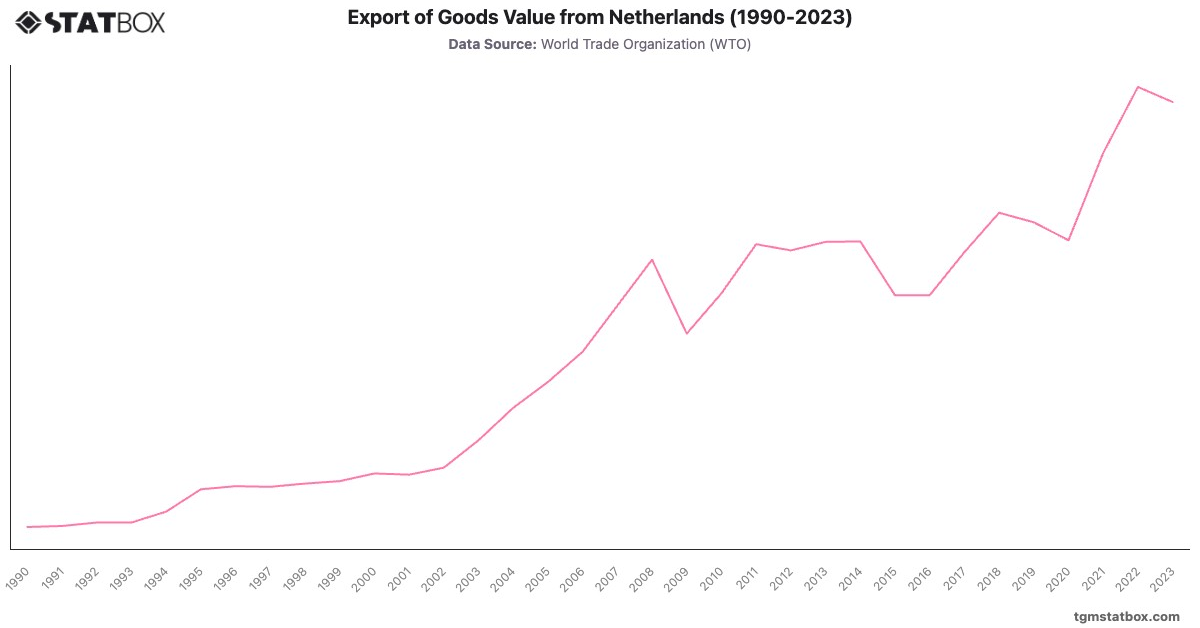
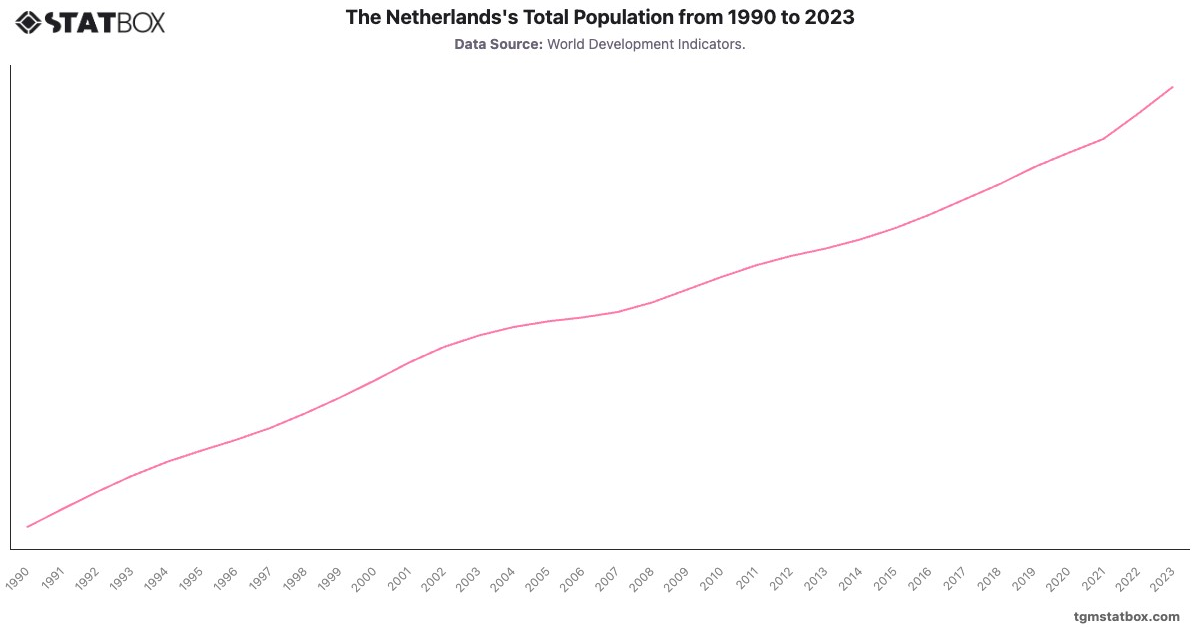
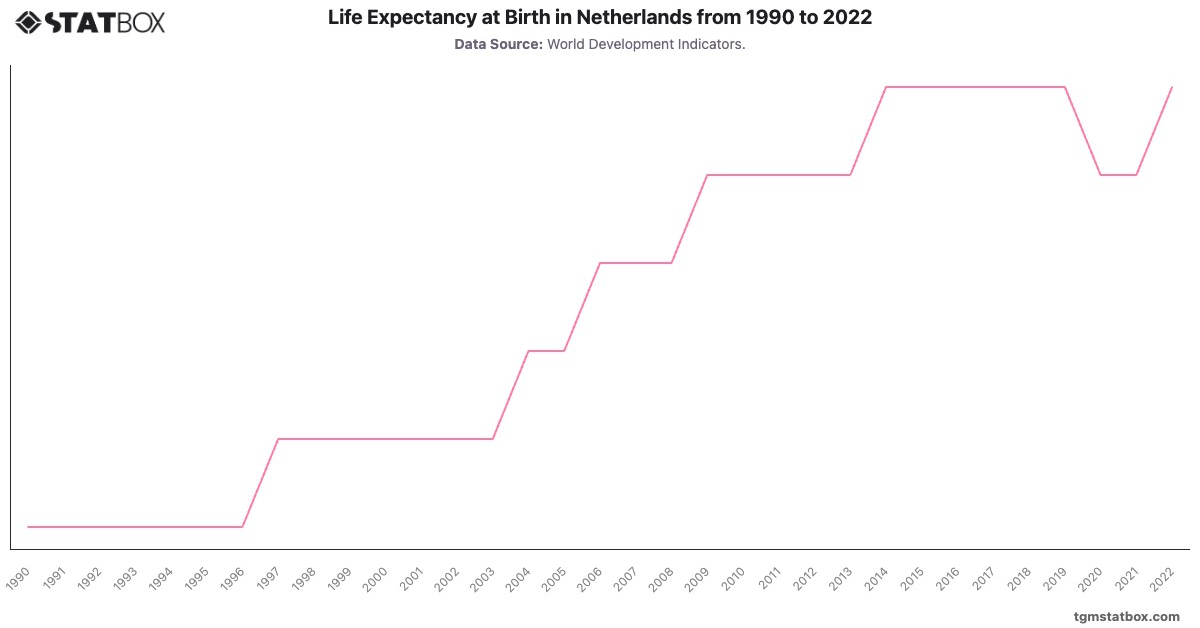
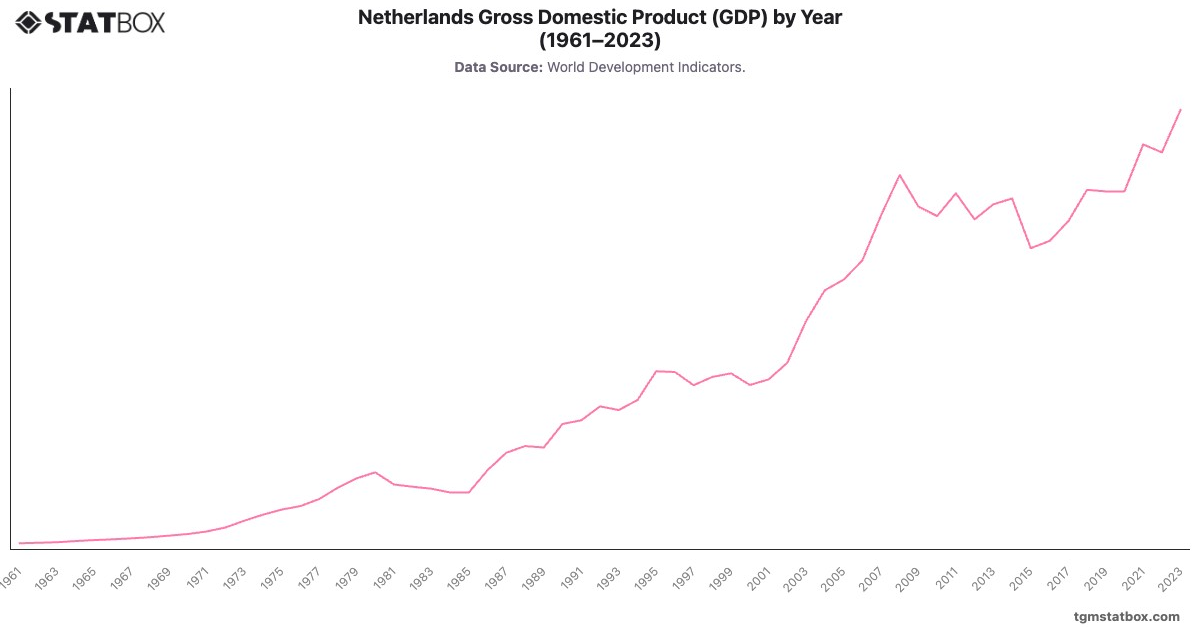
Explore related charts to gain a better understanding of Netherlands’ government debt to GDP ratio, Netherlands’s population count, Netherlands’ annual GDP growth rate.