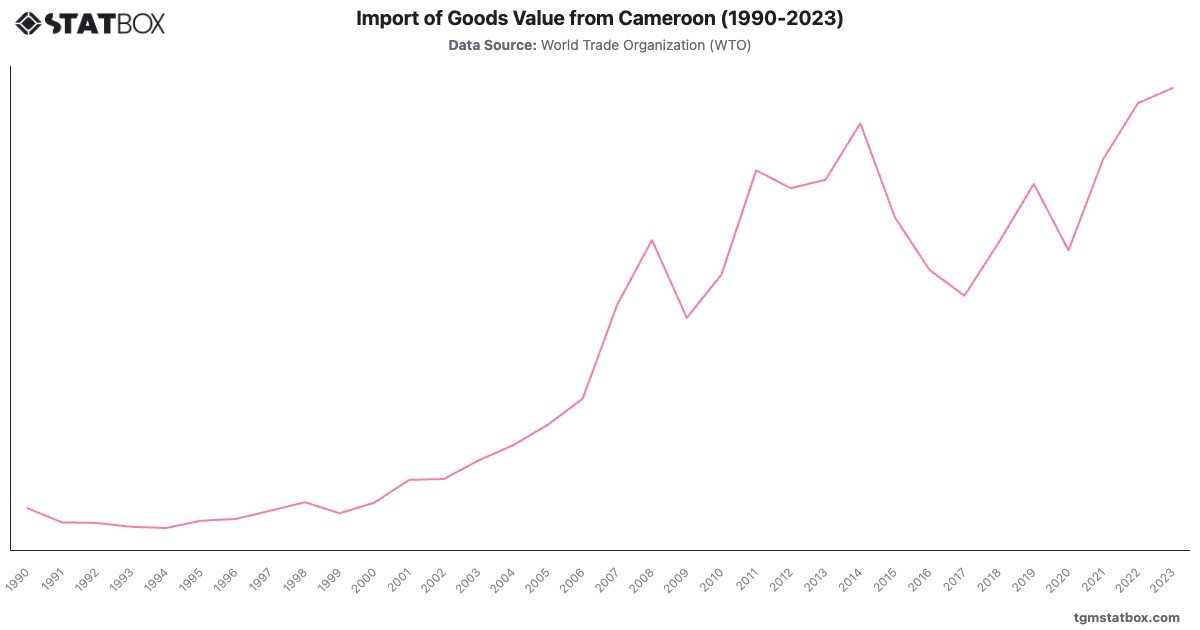
Cameroon’s imports rose steadily from $1.4B in 1990 to $5.6B in 2008, supported by investment in infrastructure and rising oil revenues. A drop during the 2009 crisis was followed by recovery, reaching $7.5B in 2014, reflecting public works and industrial growth.
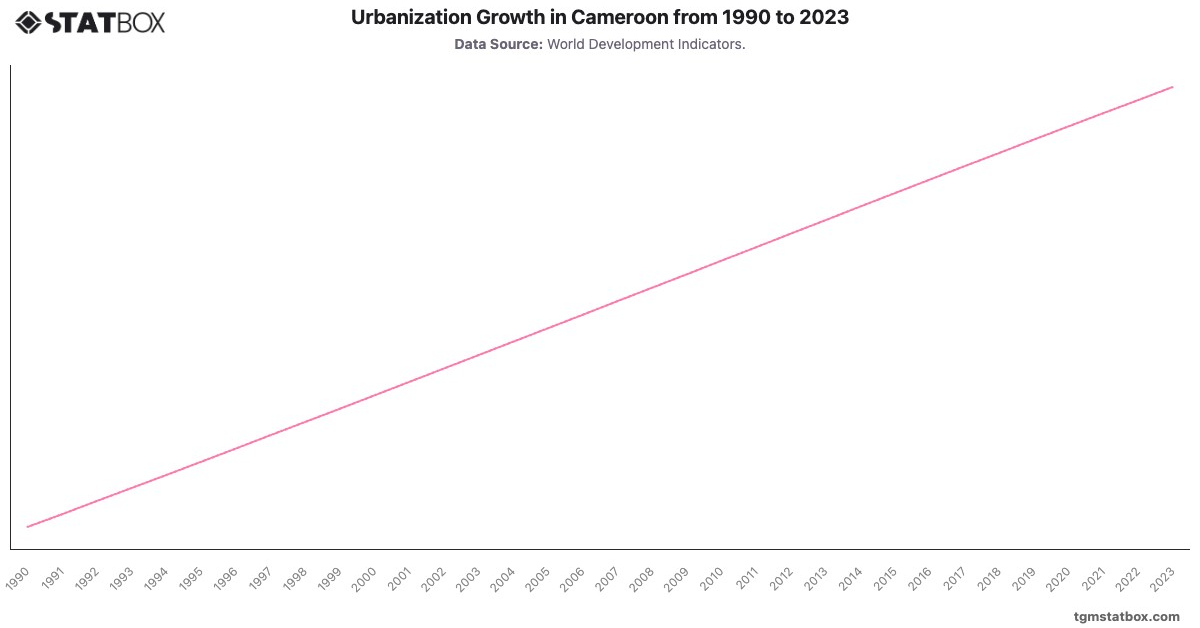
Despite challenges, imports climbed to $8.1B in 2023, driven by urbanization and demand for industrial equipment. Cameroon’s trade reflects its reliance on imported goods for infrastructure and consumer needs, underscoring its developmental trajectory amidst fluctuating global and local economic conditions.
Despite challenges, imports climbed to $8.1B in 2023, driven by urbanization and demand for industrial equipment. Cameroon’s trade reflects its reliance on imported goods for infrastructure and consumer needs, underscoring its developmental trajectory amidst fluctuating global and local economic conditions.
For additional information, visit statistics on Cameroon’s central government debt, as a percentage of GDP, Cameroon’s military personnel ratio, Cameroon’s goods export value.