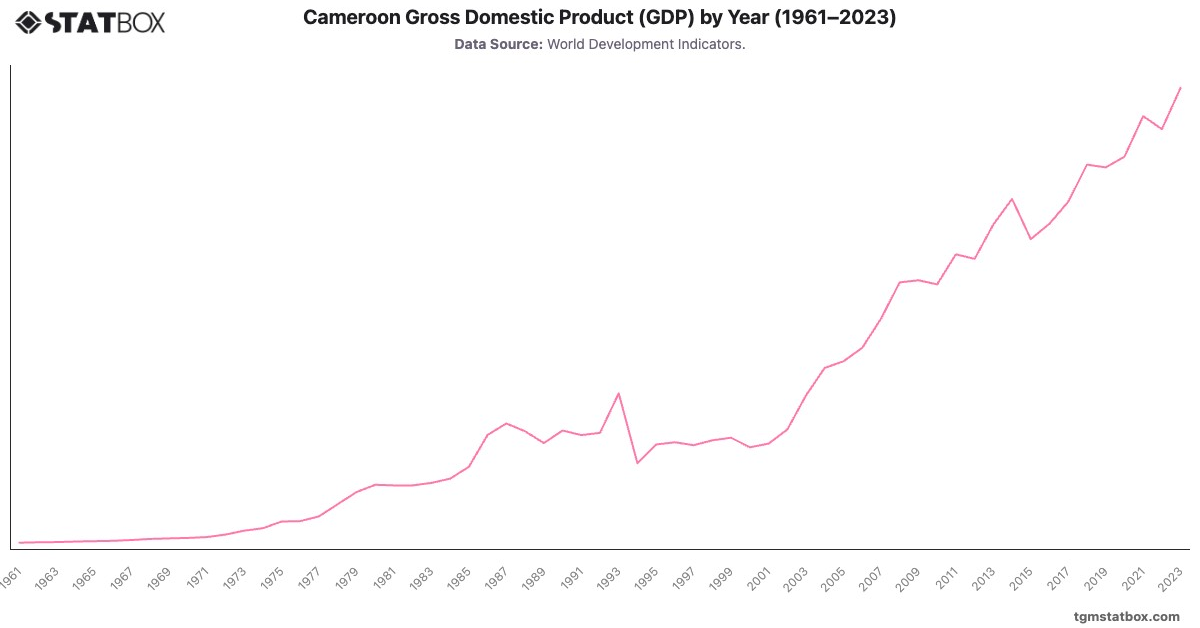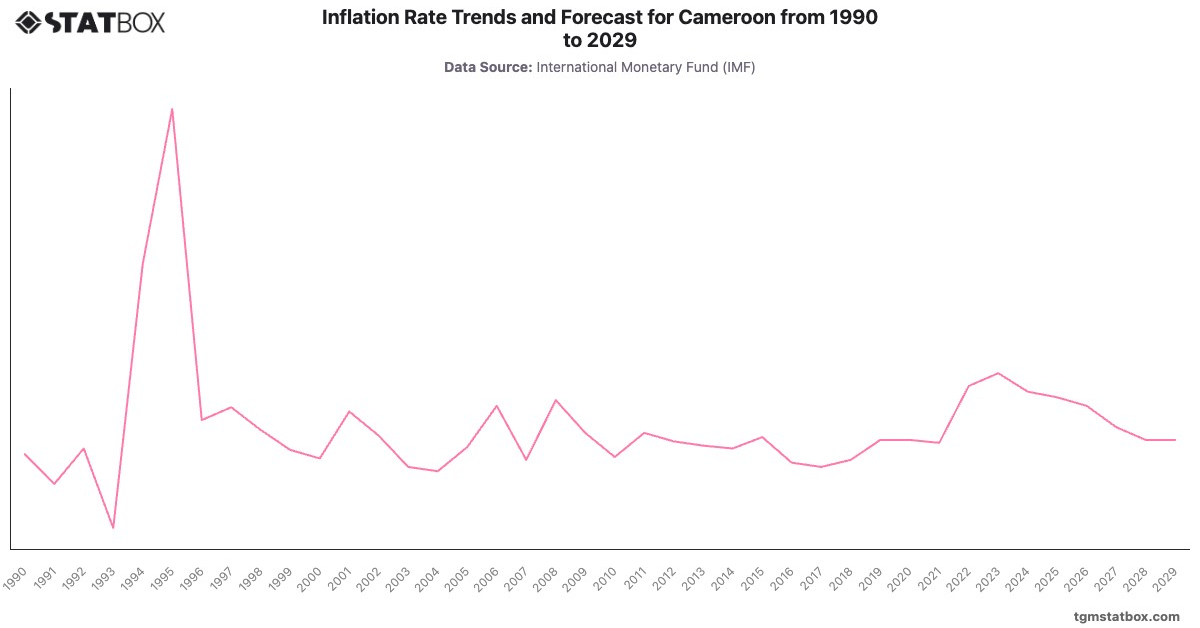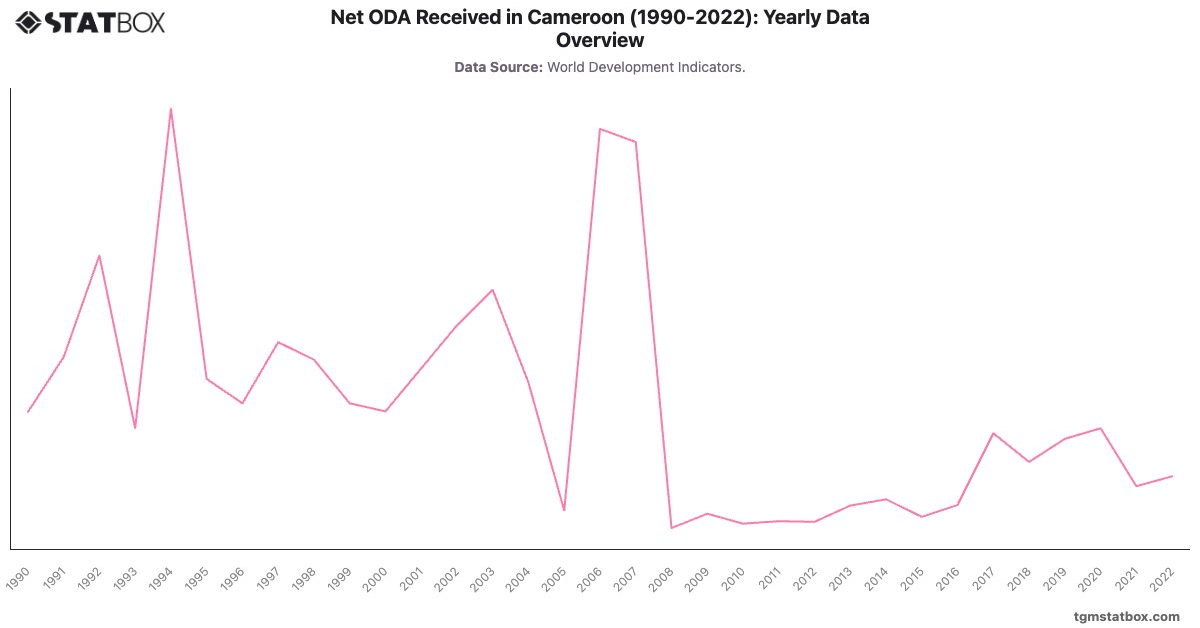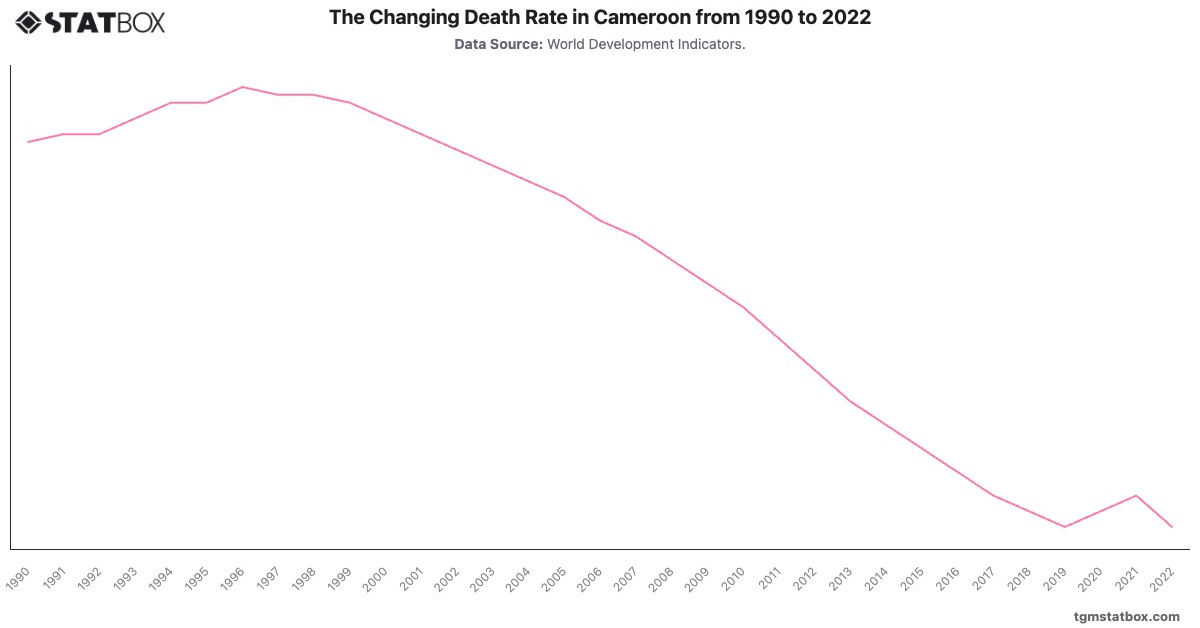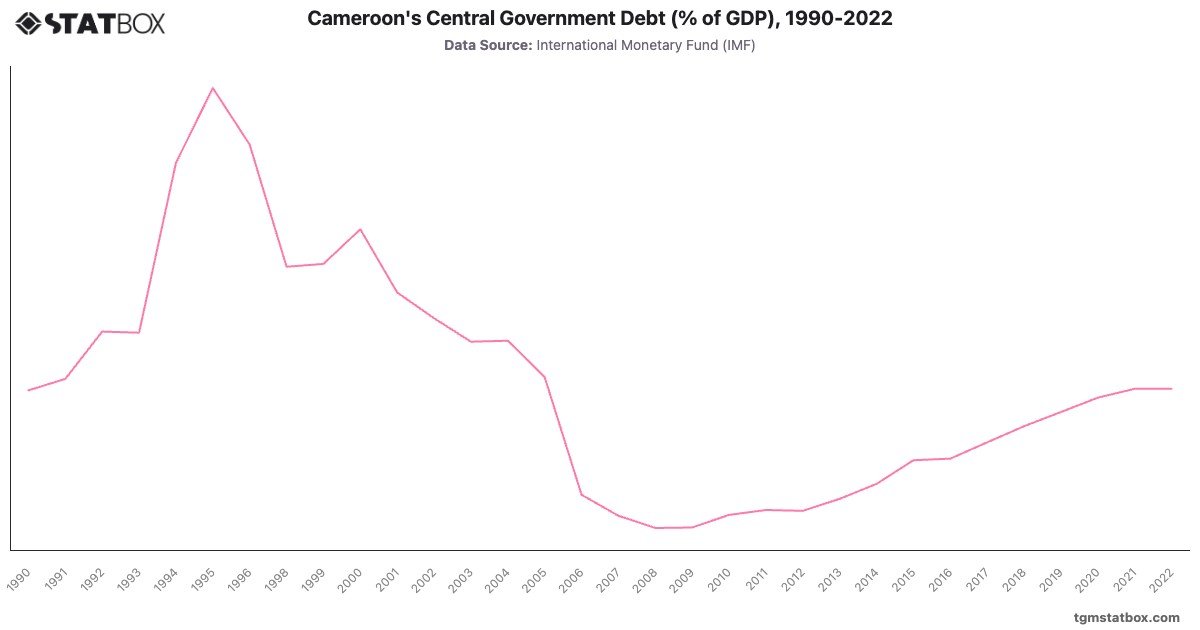
Cameroon experienced significant fluctuations in its central government debt as a percentage of GDP from 1990 to 2022. The debt surged sharply in the early 1990s, reaching a peak of in 1995, driven by a combination of declining commodity prices, economic stagnation, and structural adjustments under IMF programs. However, substantial debt relief initiatives in the 2000s, particularly through the Heavily Indebted Poor Countries (HIPC) program, contributed to a sharp reduction, with the debt falling to a low of by 2008.
Post-2008, the debt gradually increased, peaking at in 2021 as Cameroon sought to finance infrastructure projects and address economic challenges exacerbated by the COVID-19 pandemic. This rise also reflects external borrowing to sustain fiscal stability amid global economic uncertainties. The chart illustrates Cameroon’s fiscal evolution, highlighting a reliance on debt management strategies to balance growth ambitions with economic realities.
Post-2008, the debt gradually increased, peaking at in 2021 as Cameroon sought to finance infrastructure projects and address economic challenges exacerbated by the COVID-19 pandemic. This rise also reflects external borrowing to sustain fiscal stability amid global economic uncertainties. The chart illustrates Cameroon’s fiscal evolution, highlighting a reliance on debt management strategies to balance growth ambitions with economic realities.
Find out more through related statistics on Industry sector’s share in cameroon’s GDP, Cameroon’s net ODA total, Cameroon’s net lending/borrowing ratio.