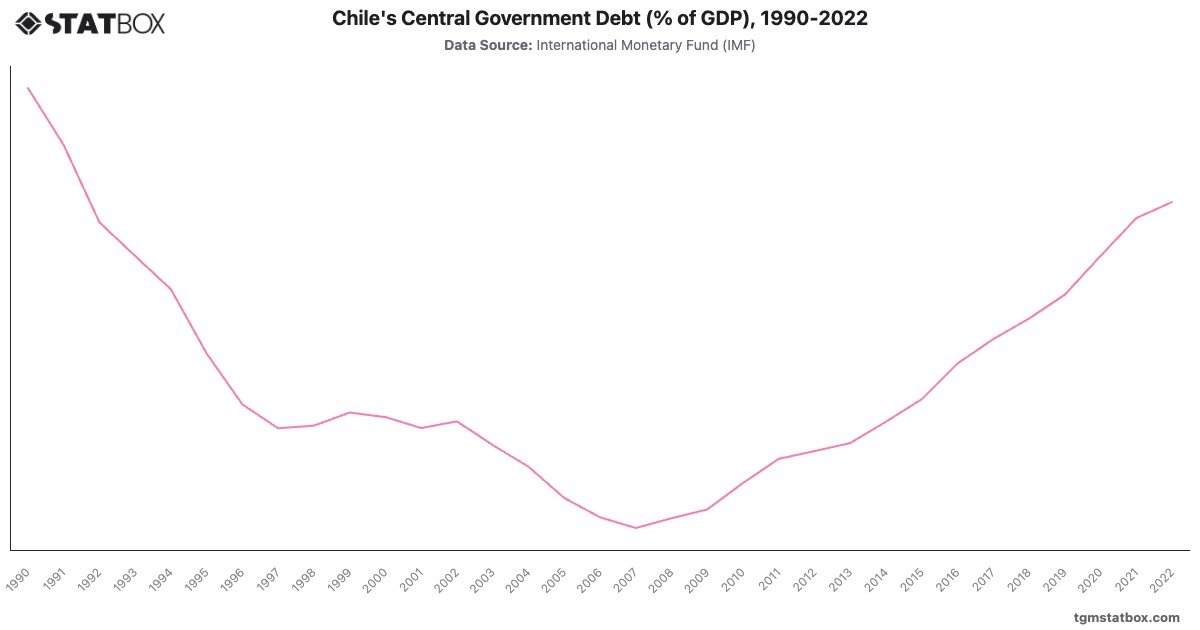
Chile's central government debt (% of GDP) showed a steady decline from in 1990 to just by 2007, supported by prudent fiscal policies, copper revenue windfalls, and the establishment of sovereign wealth funds. This trend reversed slightly in the late 2000s, with debt increasing to in 2010 following fiscal stimulus measures during the global financial crisis.
From 2010 onward, debt grew steadily, reaching by 2022. This increase reflects rising social expenditure and infrastructure investments, particularly after 2019’s social unrest and the economic impact of the COVID-19 pandemic. Chile's fiscal policies have historically balanced debt control with socioeconomic goals, as illustrated in the chart.
From 2010 onward, debt grew steadily, reaching by 2022. This increase reflects rising social expenditure and infrastructure investments, particularly after 2019’s social unrest and the economic impact of the COVID-19 pandemic. Chile's fiscal policies have historically balanced debt control with socioeconomic goals, as illustrated in the chart.
Find out more through related statistics on Chile’s goods exports value, Chile’s agriculture share in GDP, Chile’s military spending.