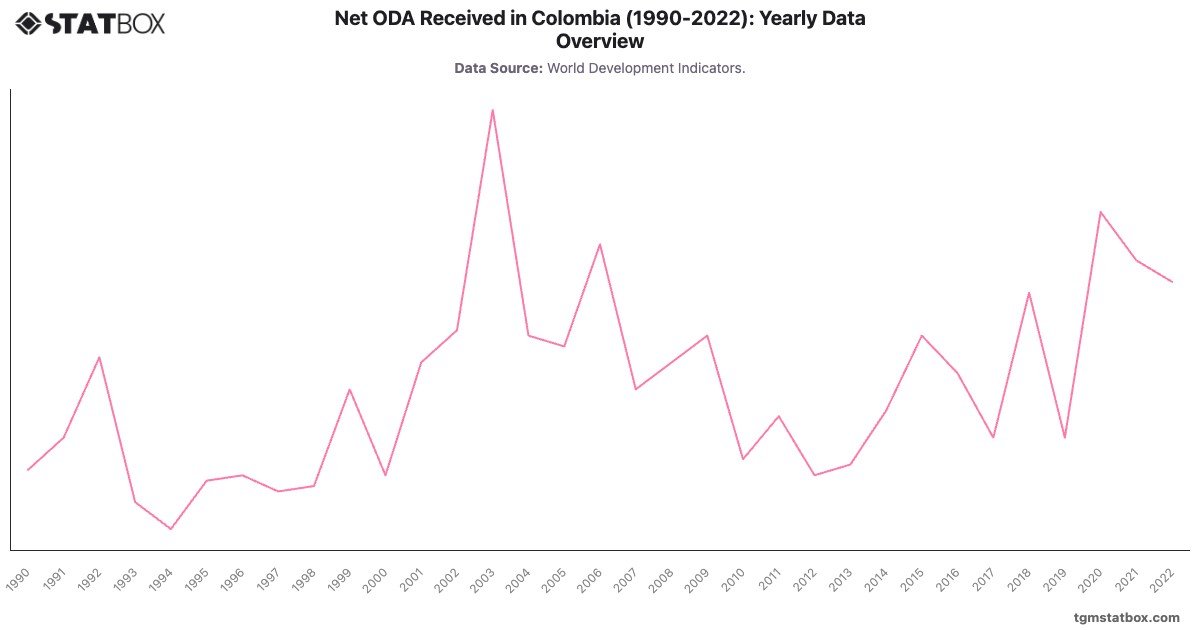
Colombia’s Net ODA (% of GNI) fluctuated moderately from 1990 to 2022, reflecting shifts in its economic and security landscape. The rise to in 2003 coincided with heightened international support for combating drug-related violence and strengthening governance under the Plan Colombia initiative. These efforts aimed to curb illegal narcotics trade and stabilize the country’s institutions.
Subsequent years saw a gradual decline, with ODA stabilizing around 0.3- in the 2010s and early 2020s, reflecting Colombia’s transition to a middle-income economy. The uptick to in 2020 likely corresponds to international support during the COVID-19 pandemic, which strained healthcare systems and economic stability.
Subsequent years saw a gradual decline, with ODA stabilizing around 0.3- in the 2010s and early 2020s, reflecting Colombia’s transition to a middle-income economy. The uptick to in 2020 likely corresponds to international support during the COVID-19 pandemic, which strained healthcare systems and economic stability.
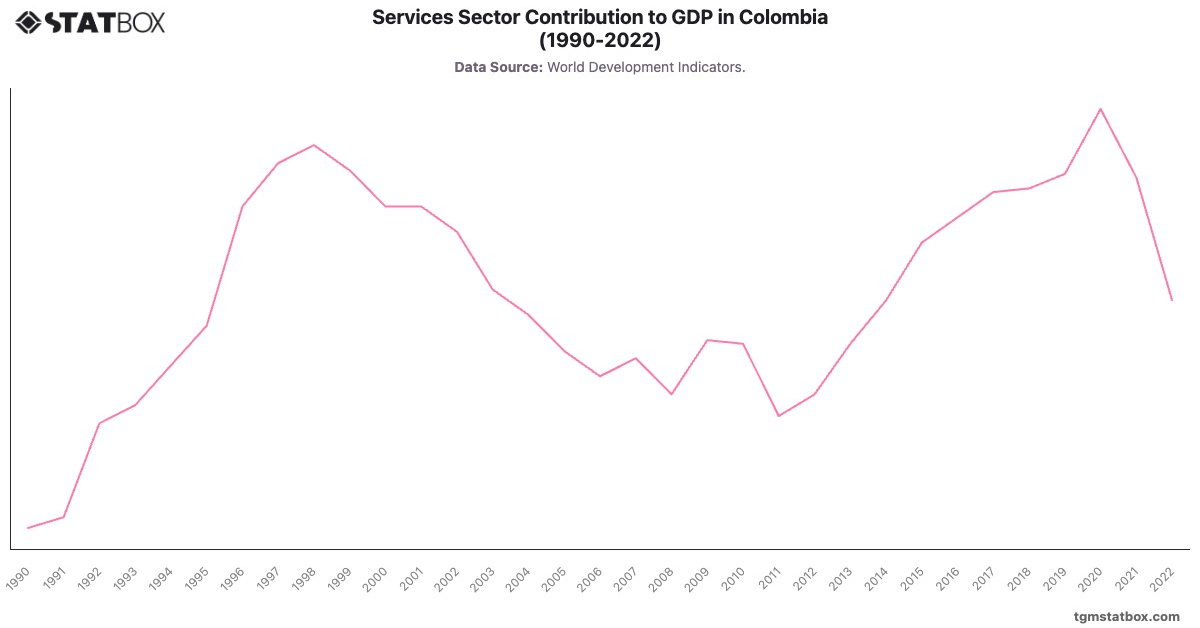
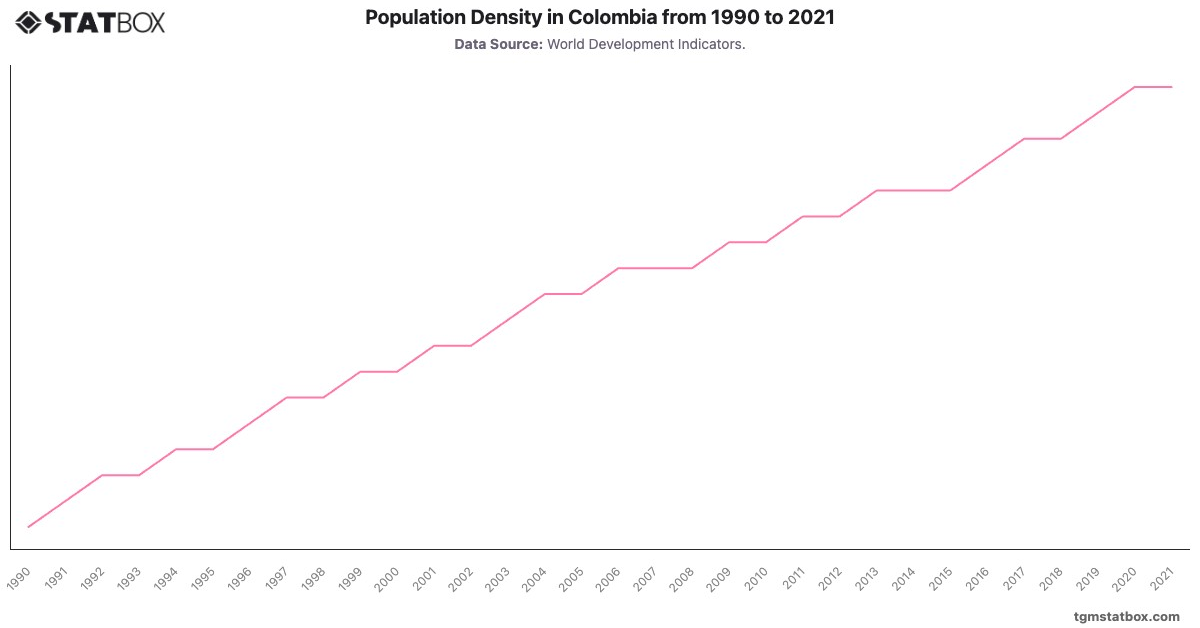
For a broader context, visit other statistics on Colombia’s services sector share in GDP, Colombia’s net lending/borrowing as a percentage of GDP, Colombia’s population numbers.