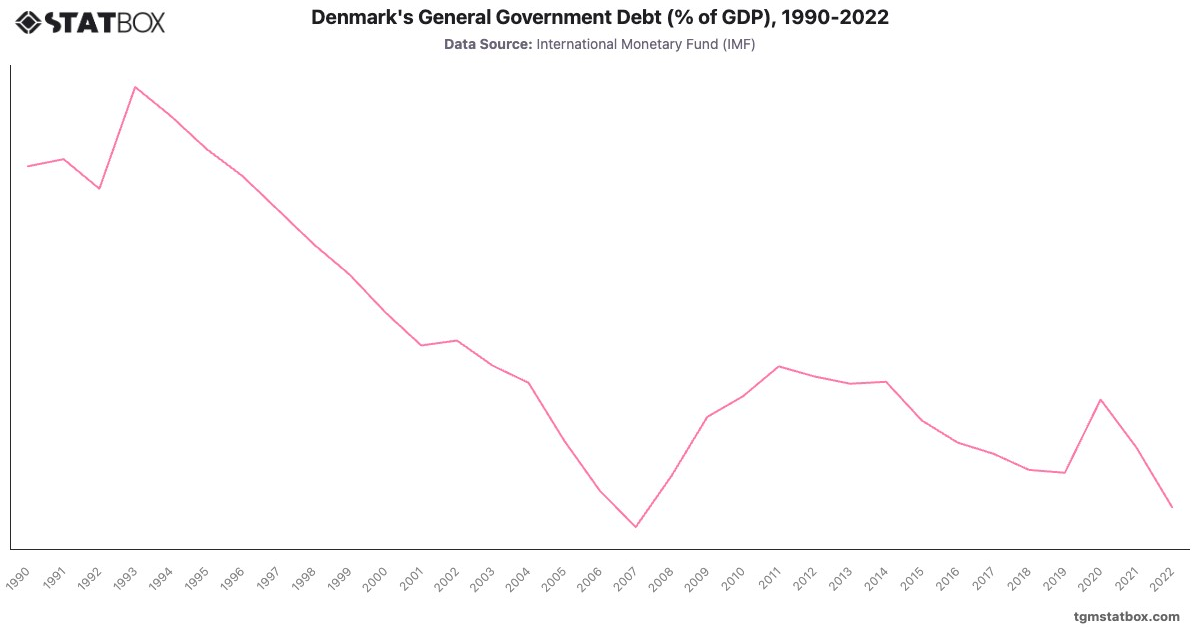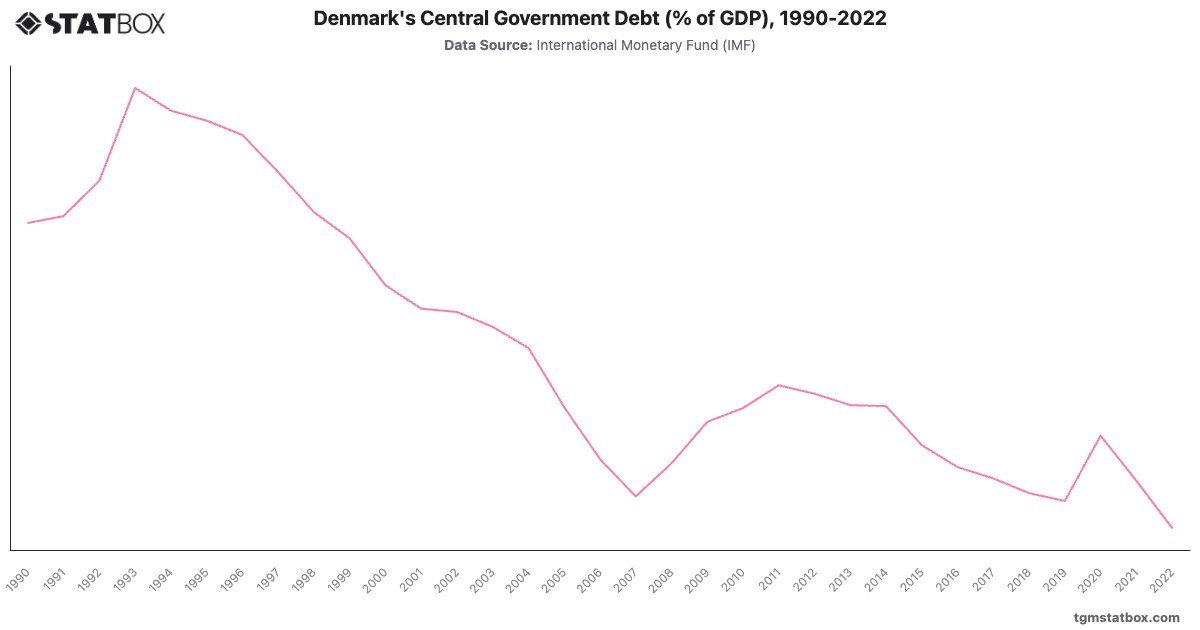
Denmark’s government debt saw a consistent reduction from its 1993 high of , driven by robust fiscal management and economic growth. By 2007, debt levels were at an impressive low of . However, the 2008 global financial crisis caused a temporary reversal, with debt increasing to in 2009.
The subsequent recovery was rapid due to Denmark's strong economic fundamentals, bringing the debt ratio back down to by 2019. Pandemic-related expenditures in 2020 pushed the debt up to , but fiscal discipline quickly reduced it to in 2022, marking one of the lowest debt ratios among developed economies.
The subsequent recovery was rapid due to Denmark's strong economic fundamentals, bringing the debt ratio back down to by 2019. Pandemic-related expenditures in 2020 pushed the debt up to , but fiscal discipline quickly reduced it to in 2022, marking one of the lowest debt ratios among developed economies.
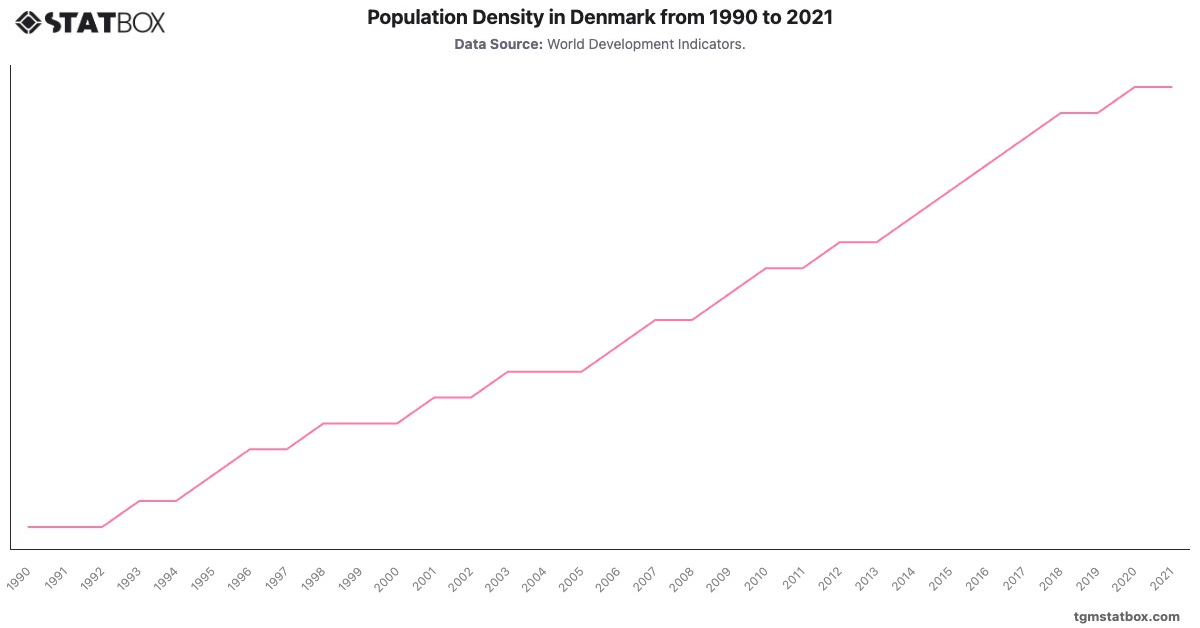
Explore related charts to gain a better understanding of Denmark’s net lending/borrowing as a percentage of GDP, Denmark’s population density, Denmark’s agriculture sector share in GDP.