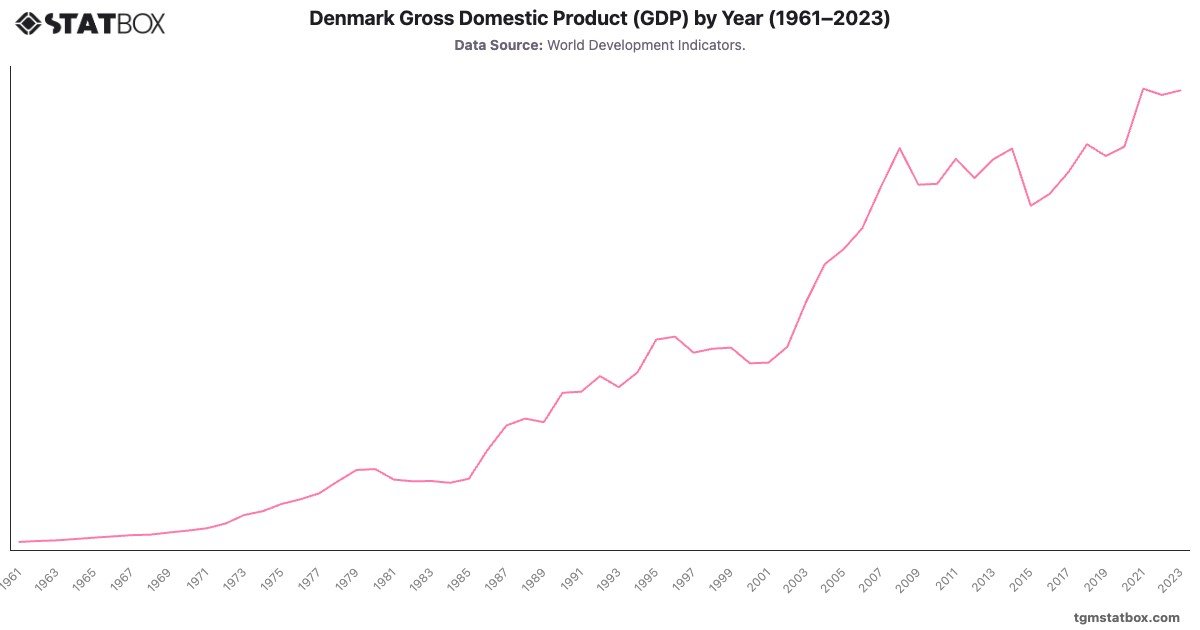
Denmark’s GDP reflects its evolution into a high-income, knowledge-based economy. Starting at $7 billion in 1961, GDP surged in the 1970s, reaching $70.3 billion in 1979, driven by industrialization and oil exploration in the North Sea. Economic challenges in the 1980s caused temporary stagnation, but reforms and globalization reignited growth, with GDP exceeding $200 billion by 2003.
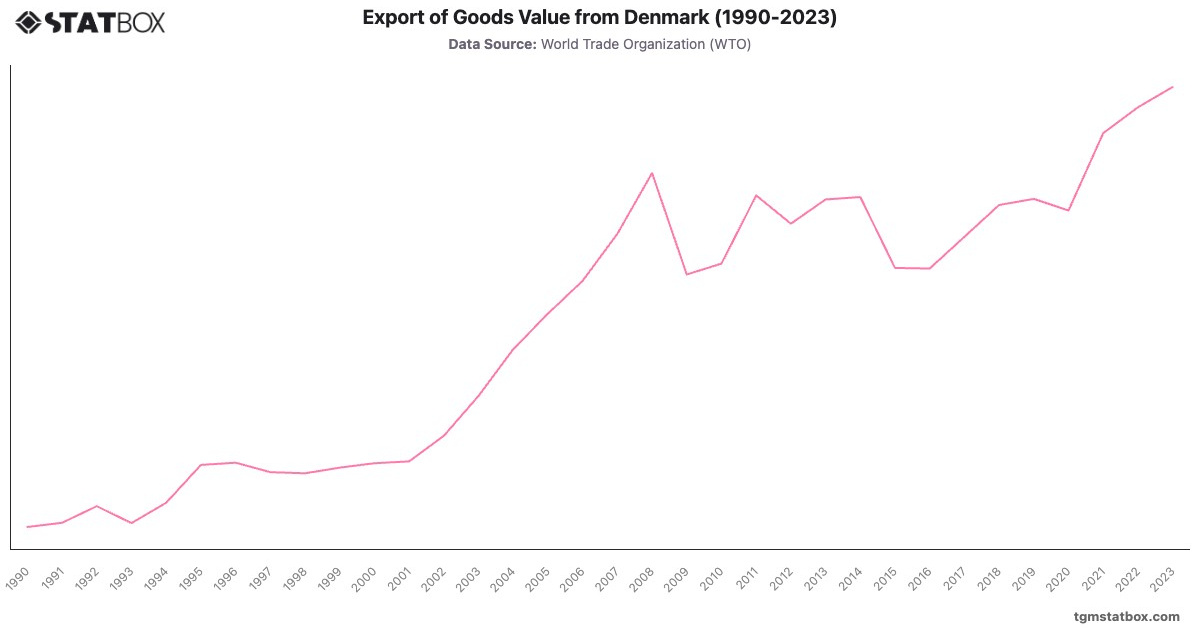
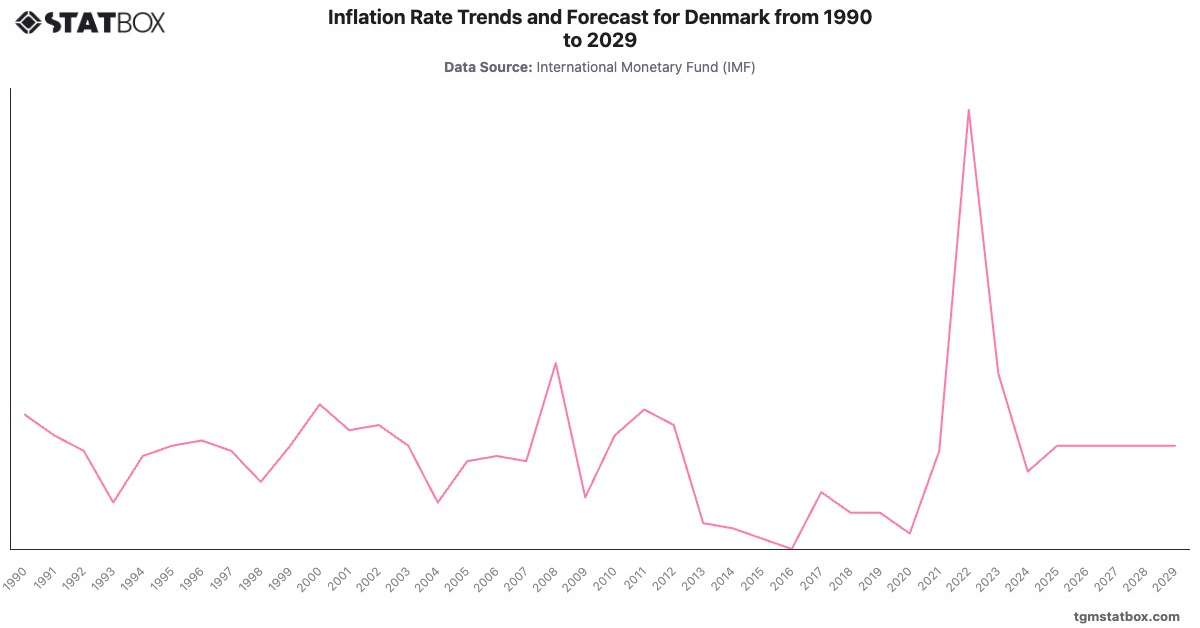
The 2008 financial crisis impacted growth, yet Denmark’s focus on renewable energy and exports fostered recovery. By 2023, GDP reached $404.2 billion, emphasizing Denmark’s resilience and innovative economic strategies.
The 2008 financial crisis impacted growth, yet Denmark’s focus on renewable energy and exports fostered recovery. By 2023, GDP reached $404.2 billion, emphasizing Denmark’s resilience and innovative economic strategies.
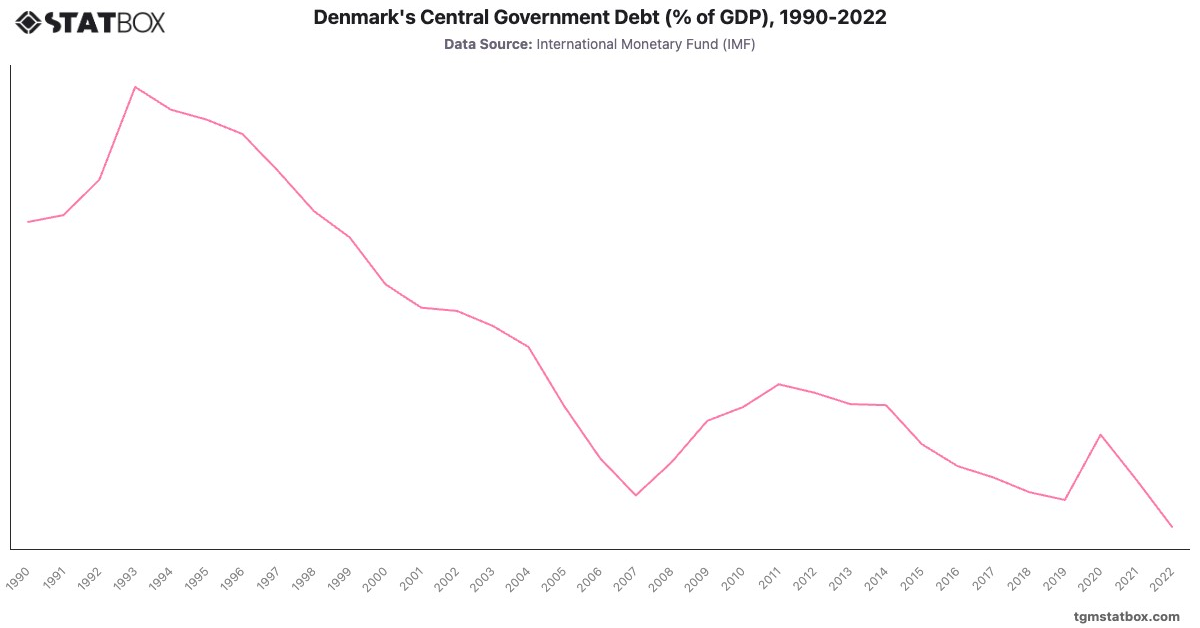
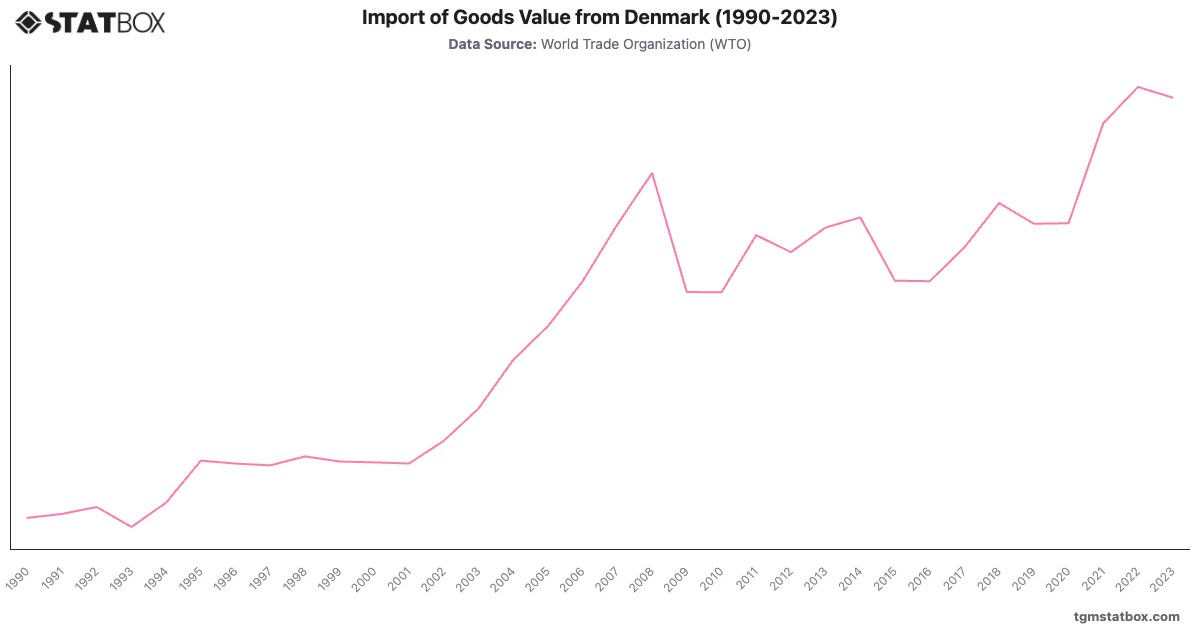
Find out more through related statistics on Denmark’s public debt ratio, Denmark’s export figures, Denmark’s unemployment rate.