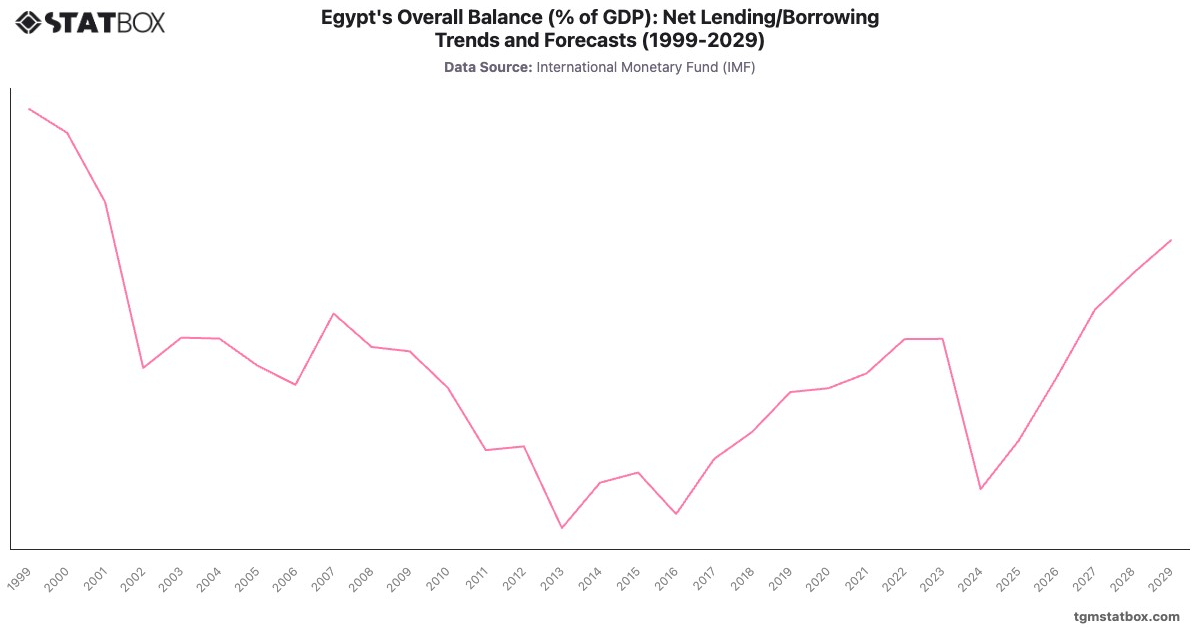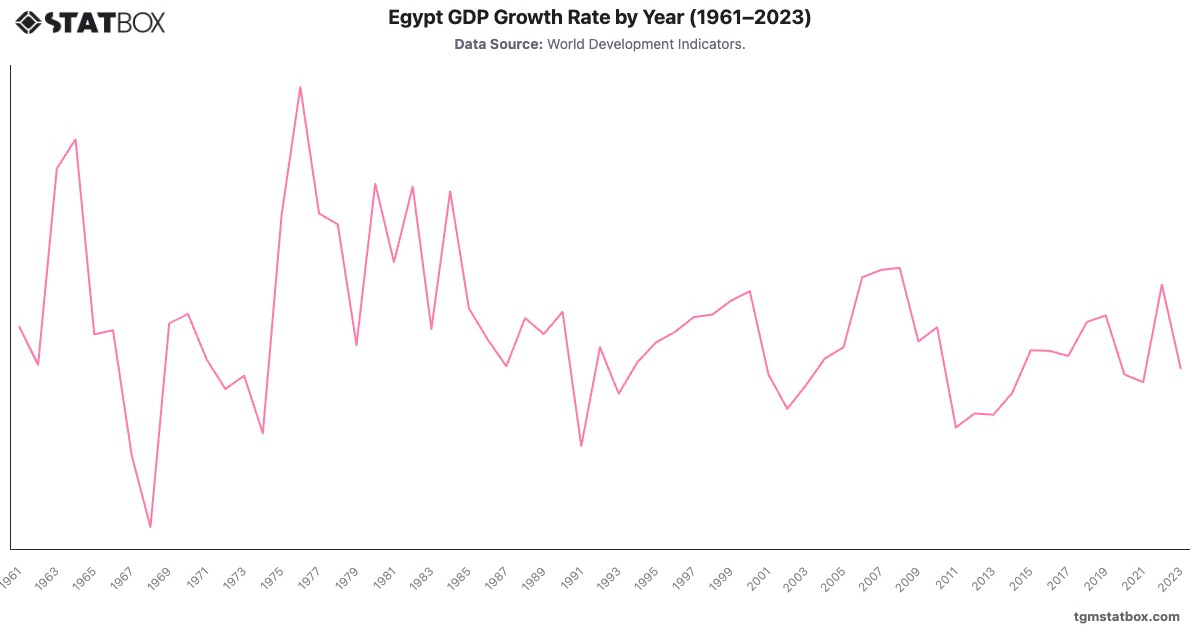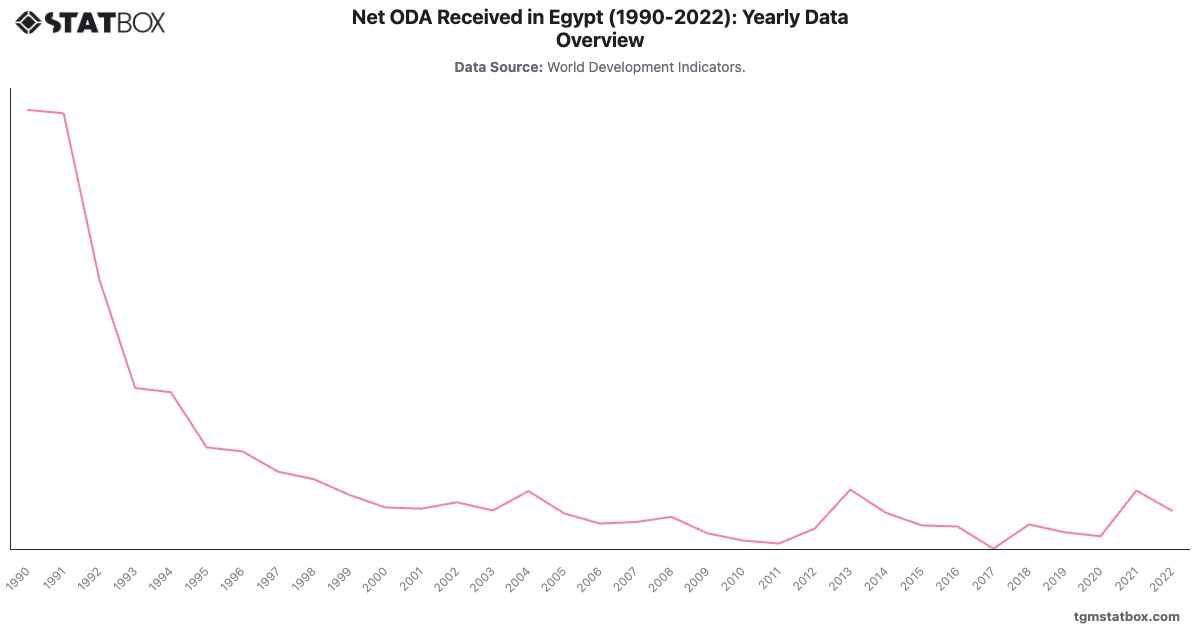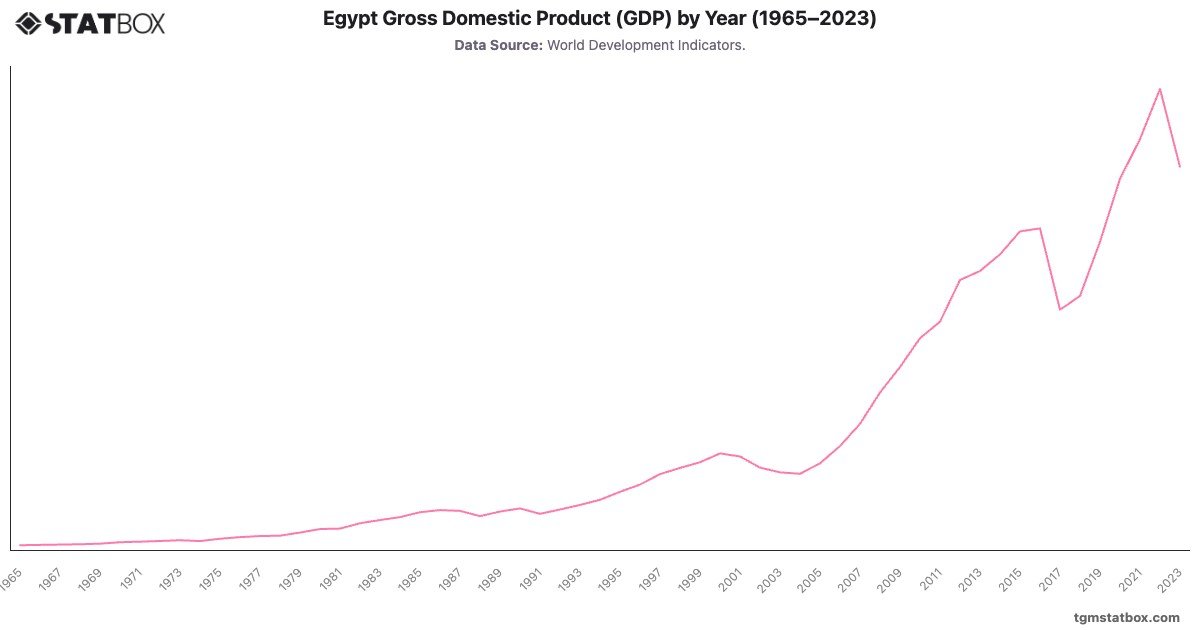
Egypt's GDP reflects significant growth over decades, driven by industrialization, trade, and reform policies. From $4.9 billion in 1965, GDP steadily increased during the 1970s, fueled by infrastructure investments and oil revenues, reaching $21.6 billion in 1980. However, the 1980s saw economic instability, with GDP fluctuating due to external debt and structural adjustments.
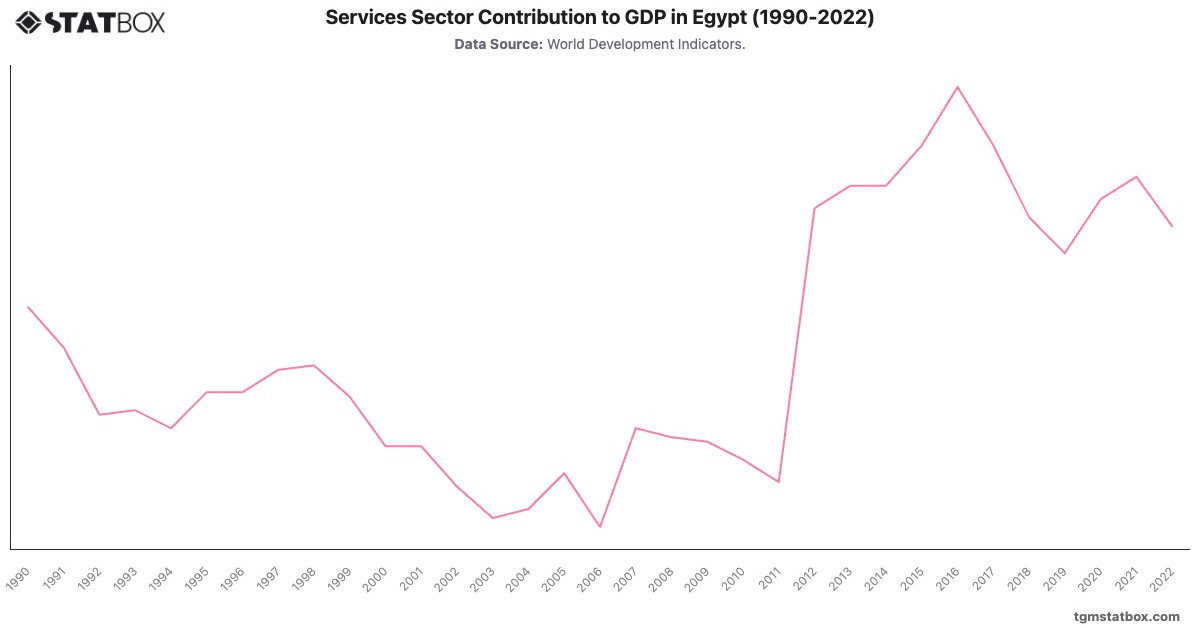
In the 2000s, GDP growth accelerated, peaking at $332.4 billion in 2016, supported by reforms and a growing services sector. The COVID-19 pandemic briefly disrupted growth, but Egypt's diversified economy enabled a rebound to $476.7 billion in 2022. However, currency devaluations impacted GDP in 2023, reflecting underlying fiscal challenges.
In the 2000s, GDP growth accelerated, peaking at $332.4 billion in 2016, supported by reforms and a growing services sector. The COVID-19 pandemic briefly disrupted growth, but Egypt's diversified economy enabled a rebound to $476.7 billion in 2022. However, currency devaluations impacted GDP in 2023, reflecting underlying fiscal challenges.
For a deeper dive into the topic, explore Egypt’s unemployment rate, Egypt’s agriculture share in GDP, Egypt’s population growth rate.